Innovative Data Analytics PowerPoint Presentation Template

Data analytics slide featuring eight colored peaks with percentage labels, representing various content metrics.
P.ID : 8312
    16 slides
    Data cleansing cycle PowerPoint slides with different colorful layout designs with icons and text descriptions.
    13 slides
    Data analysis PowerPoint featuring an illustration of data charts and various slides layouts for analysis steps.
    13 slides
    Informative slides about data science, highlighting colorful different layout designs and icons.
    374 views
    15 Downloads
    Get Custom Slides by Experts
    Instantly Access Templates in PowerPoint

    Editable Data visualization PPT Template


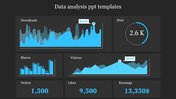
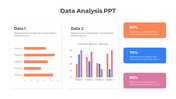
    Welcome to a world where data speaks volumes and insights drive decisions. Our Data Analytics PowerPoint Templates are your gateway to presenting complex data with clarity, precision, and impact. This Data Analysis slide displays a bar chart or graph with eight bars, each representing a different content category. The bars vary in height, indicating the performance or success rate of each content type. The colors used in the bars add visual appeal and help differentiate the categories.

    Professionals navigating the complexities of data analysis, students learning the fundamentals of analytics, or anyone seeking to leverage data to make informed decisions. Our Data Analytics PowerPoint templates are versatile, user-friendly, and tailored to suit a variety of presentation needs. Ready to elevate your data presentations? Download our templates and Google Slides Themes now and unleash the full potential of your data storytelling.

    Features of the template:

    •  Slides are available in 4:3 & 16:9
    • Well-crafted template with instant download.
    • Get slides that are 100% customizable and easy to download
    Advertisement

    You May Also Like These PowerPoint Templates

    Free
    Add to Wishlist
    Download
    AI Customize
    Visual representation of data classification, featuring a laptop and labeled categories on a purple background.
    Add to Wishlist
    Download
    AI Customize
    Horizontal bar chart displaying data for five months and six regions, with four labeled icons in blue, purple, red, and teal.
    Add to Wishlist
    Download
    AI Customize
    Data analytics slide featuring laptops, tablets, charts, and graphs, with four options and icons listed below.
    Add to Wishlist
    Download
    AI Customize
    Hexagonal Flowchart of data science applications in social media, highlighting from recommendation engine upto optimization.
    Add to Wishlist
    Download
    AI Customize
    A 3D smartphone graphic showing data lines and charts, with white text on the left, set against a blue backdrop.
    Add to Wishlist
    Download
    AI Customize
    Best Data Science Template Slides Presentation
    Add to Wishlist
    Download
    AI Customize
    Support model diagram with six colorful triangles with icons showing data driven, cost efficient, and flexible strategies.
    Add to Wishlist
    Download
    AI Customize
    Pack of slide showcasing data collection methods with icons in different colors on a white backdrop.
    Add to Wishlist
    Download
    AI Customize
    Data science benefits visualized in a four step process with numbered colorful tabs in pink, green, orange, and blue.
    Add to Wishlist
    Download
    AI Customize
    Collection of data analytics icons, including charts, browser windows, magnifying glasses, and statistical graphs.
    Add to Wishlist
    Download
    AI Customize
    Editable Data Mining Essentials PPT And Google Slides
    Add to Wishlist
    Download
    AI Customize
    A pack of qualitative research method slides showcasing various colorful layout designs and icons.
    Add to Wishlist
    Download
    AI Customize
    Data analytics slide with six labeled captions, each featuring a colored status indicator in green, orange, or red.
    Add to Wishlist
    Download
    AI Customize
    The data analysis slide has large text, a variety of icons above a person's silhouette, and color options at the bottom.
    Add to Wishlist
    Download
    AI Customize
    Five colored diamond shapes representing data cleansing strategies, such as automated validation and error detection.