Data Collection Methods PowerPoint And Google Slides

Pack of 11 slides
P.ID : 71721
Advertisement
412 views
65 Downloads
Get Custom Slides by Experts
Instantly Access Templates in PowerPoint

Data Collection Methods Presentation Slides


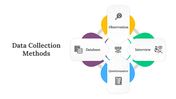
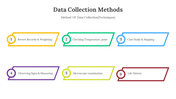
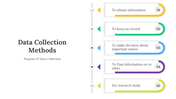
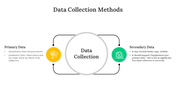
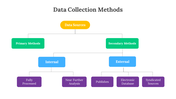
Data Collection Methods encompass the systematic processes for gathering data from diverse sources and subjects using various research techniques. This vital aspect of research and analysis involves methods like surveys, interviews, observations, and more, tailored to specific research objectives. Accurate and reliable data collection is essential for making informed decisions and conducting meaningful studies. it is  PowerPoint template is a valuable resource for researchers, analysts, and educators. This user-friendly template equips users with in-depth insights into various data collection techniques and their real-world applications. Featuring fully editable slides and comprehensive information about each method, it simplifies the complex task of understanding and presenting these techniques. Researchers can harness the informative content provided in this template to improve their research methodologies and ensure the collection of high-quality data. With a professional and engaging design, it facilitates effective presentations on data collection, serving as an indispensable tool for anyone involved in research and data analysis.

Features of the templates:


  • 100% customizable slides and easy to download.
  • Slides are available in different nodes & colors.
  • The slide contained 16:9 and 4:3 formats.
  • Easy to change the slide colors quickly.
  • It is a well-crafted template with an instant download facility.

You May Also Like These PowerPoint Templates

Add to Wishlist
Download
AI Customize
Environmental data slide with a bar chart displaying statistics for humans, trees, animals, and water with placeholder text.
Add to Wishlist
Download
AI Customize
Data modeling PowerPoint template illustrating the process from table to graph, database, and pie chart with captions.
Free
Add to Wishlist
Download
AI Customize
Data analysis slide with a business figure illustration and bar chart, featuring four colorful captions on a dark backdrop.
Add to Wishlist
Download
AI Customize
Slides featuring an overview of data aggregation processes with numbered steps in different colorful layout designs.
Free
Add to Wishlist
Download
AI Customize
Six hexagons in different colors encircling a central data icon, each labeled with numbers and captions.
Add to Wishlist
Download
AI Customize
A PowerPoint template outlining the responsibilities of a data scientist, featuring four key tasks in a diamond layout.
Add to Wishlist
Download
AI Customize
Three bar charts in red, blue, and green, with captions and text below each for data analysis insights.
Add to Wishlist
Download
AI Customize
A data analytics slide featuring a magnifying glass icon at the center, surrounded by sections for various analytics topics.
Add to Wishlist
Download
AI Customize
Data modelling basics featuring a colorful flowchart with various input and output text boxes with placeholders.
Add to Wishlist
Download
AI Customize
Magnifying glass in the center highlighting a chart, surrounded by six colorful analytics icons and each with caption areas.
Add to Wishlist
Download
AI Customize
Central red diamond with data chart icon, encircled by four red and white nodes forming a cross layout.
Add to Wishlist
Download
AI Customize
Three overlapping circles in blue, green, and red, with numbers at the intersections and icons in each section.
Free
Add to Wishlist
Download
AI Customize
Bar chart with five vertical bars representing data analysis with various high, low, and volume indicators displayed.
Free
Add to Wishlist
Download
AI Customize
Data modelling slide featuring four circular sections with different icons and placeholder text.
Add to Wishlist
Download
AI Customize
Four folder icons in blue, yellow, red, and green, aligned horizontally, with numbers and captions below.
Add to Wishlist
Download
AI Customize
Data analytics slide with project progress bars from November to February, showing percentages for each month.
Add to Wishlist
Download
AI Customize
Applications of Data Science in retail marketing, including recommendation systems to inventory management with text.
Add to Wishlist
Download
AI Customize
Comparison slide with a green and blue area graph and demographic data with icons and percentage on the right.
Free
Add to Wishlist
Download
AI Customize
Four vertical rectangular boxes in purple, teal, red, and orange with text sections and matching icons at the bottom.
Add to Wishlist
Download
AI Customize
Four hexagons in blue, teal, pink, and balck, each with icons and linked to a gray text box.
Add to Wishlist
Download
AI Customize
A structured chart of green bars, light and dark shades alternating, over a blue lined background with descriptive labels.
Add to Wishlist
Download
AI Customize
Data analytics layout featuring a central gray magnifying glass and three orange icons linked to labeled sections.
Add to Wishlist
Download
AI Customize
Line chart in green, red, and yellow with three product data columns paired with circular percentage boxes and text segments.
Add to Wishlist
Download
AI Customize
Illustration of a magnifying glass in gray with red icon and two text elements, highlighting data analysis themes.
Add to Wishlist
Download
AI Customize
Data analytics template with a central magnifying glass and surrounding icons place with caption areas.
Add to Wishlist
Download
AI Customize
Data analysis template with a bar graph and illustrated dashboard layout with two caption areas for data.
Free
Add to Wishlist
Download
AI Customize
Slide featuring icons for data modeling, including a table, pie chart, database, file, and briefcase with captions.
Add to Wishlist
Download
AI Customize
Data modeling diagram with icons for databases, charts, and documents alongside five labeled arrows in vibrant colors.
Add to Wishlist
Download
AI Customize
Get alluring Data Modelling PowerPoint Download slides
Add to Wishlist
Download
AI Customize
Data modeling PowerPoint slide featuring a central table with icons for data, file management, charts, and documents.
Add to Wishlist
Download
AI Customize
Three layer 3D pyramid diagram in green, blue, and red with text labels, representing a data modeling concept.