Get alluring Data Modelling PowerPoint Download slides


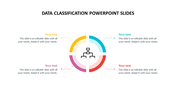
Eye Catching Data Modeling PowerPoint Slide
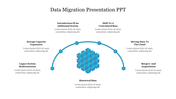
Try our new innovative data modeling slide with easy edit options. Here the slide is built with unique colors and distinctive shapes that help in sharing your content impressively. Four nodes in the slides with impressive 3D designs look eye-catching with vibrant colors. It contains icons so that you can present your data precisely. You can also highlight your data through pie charts. It is easy to personalize this slide through Google Slides and MS PowerPoint. The plain white background applied in this slide exposes the colors and inner contents more bright. You can add your texts freely in this presentation slide. Grab Now!!!
Features of the template
- 100% customizable slides and easy to download.
- Slides are available in different nodes & colors.
- The slide contains 16:9 and 4:3 formats.
- Easy to change the colors of the slide quickly.
- Well-crafted template with instant download facility.
- Rich quality and pre-planned structures.


You May Also Like These PowerPoint Templates
Add to Wishlist
Download
Edit

Add to Wishlist
Download
Edit

Add to Wishlist
Download
Edit

Add to Wishlist
Download
Edit

Add to Wishlist
Download
Edit


Add to Wishlist
Download
Edit

Add to Wishlist
Download
Edit

Add to Wishlist
Download
Edit

Add to Wishlist
Download
Edit

Add to Wishlist
Download
Edit

Add to Wishlist
Download
Edit

Add to Wishlist
Download
Edit

Add to Wishlist
Download
Edit

Add to Wishlist
Download
Edit


Add to Wishlist
Download
Edit


Add to Wishlist
Download
Edit
