Best Data Science PPT Template & Google Slides Presentation

A slide on data science featuring illustrative graphics and bullet points and its interdisciplinary nature and applications.
P.ID : 63343
    1.2K+ views
    171 Downloads
    Get Custom Slides by Experts
    Instantly Access Templates in PowerPoint

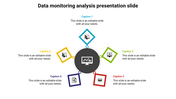
    Data Science Presentation Slide

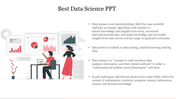
    Data Science is an interdisciplinary field that involves the extraction, analysis, and interpretation of data using advanced computational and statistical techniques. It encompasses a range of skills and tools, including programming languages, machine learning algorithms, and data visualization tools. Data Science is used in various industries, such as healthcare, finance, and marketing, to help make informed decisions based on data-driven insights. It involves the use of large and complex datasets to uncover patterns, trends, and insights that can inform business strategy and decision-making. You can impress your audience with this sleek template.


    Feature of the template  

    • 100% customizable slide and easy to download.
    • The slide contained 16:9 and 4:3 format.
    • Well-crafted template with an instant download facility.
    • Highly compatible with PowerPoint and Google Slides.
    • This slide has a colorful design pattern.
    • Easy to change the slide colors.
    Advertisement

    You May Also Like These PowerPoint Templates

    Add to Wishlist
    Download
    AI Customize
    Central magnifying glass with surrounding icons representing different data analytics elements.
    Add to Wishlist
    Download
    AI Customize
    Environmental data slide with a bar chart displaying statistics for humans, trees, animals, and water with placeholder text.
    Free
    Add to Wishlist
    Download
    AI Customize
    Data analysis slide with a business figure illustration and bar chart, featuring four colorful captions on a dark backdrop.
    Add to Wishlist
    Download
    AI Customize
    Slides featuring an overview of data aggregation processes with numbered steps in different colorful layout designs.
    Free
    Add to Wishlist
    Download
    AI Customize
    Six hexagons in different colors encircling a central data icon, each labeled with numbers and captions.
    Add to Wishlist
    Download
    AI Customize
    A PowerPoint template outlining the responsibilities of a data scientist, featuring four key tasks in a diamond layout.
    Add to Wishlist
    Download
    AI Customize
    Three bar charts in red, blue, and green, with captions and text below each for data analysis insights.
    Add to Wishlist
    Download
    AI Customize
    Central red diamond with data chart icon, encircled by four red and white nodes forming a cross layout.
    Add to Wishlist
    Download
    AI Customize
    Data analytics slide with project progress bars from November to February, showing percentages for each month.
    Add to Wishlist
    Download
    AI Customize
    Applications of Data Science in retail marketing, including recommendation systems to inventory management with text.
    Add to Wishlist
    Download
    AI Customize
    Comparison slide with a green and blue area graph and demographic data with icons and percentage on the right.
    Add to Wishlist
    Download
    AI Customize
    Four hexagons in blue, teal, pink, and balck, each with icons and linked to a gray text box.
    Add to Wishlist
    Download
    AI Customize
    A structured chart of green bars, light and dark shades alternating, over a blue lined background with descriptive labels.
    Add to Wishlist
    Download
    AI Customize
    Line chart in green, red, and yellow with three product data columns paired with circular percentage boxes and text segments.
    Add to Wishlist
    Download
    AI Customize
    Data analytics template with a central magnifying glass and surrounding icons place with caption areas.