Amazing Data Science PPT Presentation Slide Tempalte

3D data visualization with charts on a tablet and two hexagonal stats, displayed on a dark blue background.
P.ID : 55542
    11 slides
    Data classification slides illustrate a circular process with four steps with different layout designs and icons.
    11 slides
    A flowchart slides illustrating the data hygiene process with steps in different layout designs accompanied by icons.
    11 slides
    Data scrubbing process diagram PPT slides showcasing steps with different colorful layout designs and icons.
    12 slides
    A collection of business data analysis PPT slides with colorful charts and infographics with icons on a white backdrop.
    16 slides
    Data cleansing cycle PowerPoint slides with different colorful layout designs with icons and text descriptions.
    568 views
    76 Downloads
    Get Custom Slides by Experts
    Instantly Access Templates in PowerPoint

    Attractive Data Science Presentation Slide

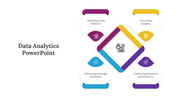
    Generate your data science concepts to inspire your audiences. Best Data Science PPT Presentation Slide Template is created to present a fantastic informative slide without difficulty. This slide is easy to use and edit for all types of meetings and conferences.

    About the Template:

    Unique Data Science PPT Presentation Slide Template helps explain the working of data science in every industry. Use this template to promote and access various analytic data uses for personal and professional development. The analytic waves background adds a classic look to your presentation. You can use font colors and designs to your preference. Create an informative slide to develop the concept of data science and inspire them to learn more about this topic. You can save yourself much time.

    Features of the Template:

    • Innovative slide background designs
    • 100% easy to edit and customize slides
    • The slide contained 16:9 and 4:3 format.
    • Easy to change the slide colors quickly.
    • The elegant look of this template will give life to your presentation.
    • Crisp and clear font styles.
    • Fantastic slide template.
    Advertisement

    You May Also Like These PowerPoint Templates

    Add to Wishlist
    Download
    AI Customize
    Illustration of a man holding a laptop with data visualization, alongside three numbered text sections with green arrows.
    Add to Wishlist
    Download
    AI Customize
    Data analysis PowerPoint featuring an illustration of data charts and various slides layouts for analysis steps.
    Add to Wishlist
    Download
    AI Customize
    Data analysis template featuring a magnifying glass graphic, numbered sections, and placeholder blocks.
    Free
    Add to Wishlist
    Download
    AI Customize
    Data analysis template with two circular progress charts displaying 70% and 45% and six labeled captions with text area.
    Add to Wishlist
    Download
    AI Customize
    Informative slides about data science, highlighting colorful different layout designs and icons.
    Add to Wishlist
    Download
    AI Customize
    Circular data science application slide with ten numbered colorful boxes, arranged in a ring around a central title.
    Free
    Add to Wishlist
    Download
    AI Customize
    Colorful circular layout with grey central circle with icon, surrounding seven nodes, illustrating data cleansing steps.
    Free
    Add to Wishlist
    Download
    AI Customize
    Visual representation of data classification, featuring a laptop and labeled categories on a purple background.
    Add to Wishlist
    Download
    AI Customize
    Horizontal bar chart displaying data for five months and six regions, with four labeled icons in blue, purple, red, and teal.
    Add to Wishlist
    Download
    AI Customize
    Data analytics slide featuring laptops, tablets, charts, and graphs, with four options and icons listed below.
    Add to Wishlist
    Download
    AI Customize
    Hexagonal Flowchart of data science applications in social media, highlighting from recommendation engine upto optimization.
    Add to Wishlist
    Download
    AI Customize
    A 3D smartphone graphic showing data lines and charts, with white text on the left, set against a blue backdrop.
    Add to Wishlist
    Download
    AI Customize
    Support model diagram with six colorful triangles with icons showing data driven, cost efficient, and flexible strategies.
    Add to Wishlist
    Download
    AI Customize
    Data science benefits visualized in a four step process with numbered colorful tabs in pink, green, orange, and blue.
    Add to Wishlist
    Download
    AI Customize
    Collection of data analytics icons, including charts, browser windows, magnifying glasses, and statistical graphs.
    Add to Wishlist
    Download
    AI Customize
    Editable Data Mining Essentials PPT And Google Slides