Mixed Methods Research PowerPoint And Google Slides Themes

Mixed Methods Research Presentation Slides
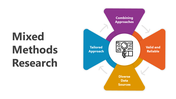
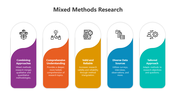
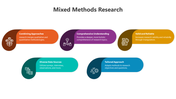
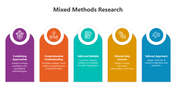
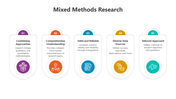
Mixed methods research, a powerful research methodology, combines the strengths of both qualitative and quantitative approaches. It allows researchers to gather, analyze, and synthesize data from diverse sources, enhancing the depth and breadth of their investigations. This methods of research enriches understanding by offering a comprehensive view of complex research questions, promoting triangulation of data, and bolstering the credibility of findings. Mixed methods research is particularly useful in social sciences, healthcare, education, and business, where understanding human behavior and experiences is essential. This mixed methods research template offers a structured and visually engaging way to present your research methodology. Designed for both novice and experienced researchers, it features fully editable slides that save time and streamline the research presentation process. Users can customize content, and diagrams to meet their specific research needs. The template’s clarity, professionalism, and visual appeal enhance the presentation's impact. Benefit from a professionally designed template that simplifies complex concepts and encourages audience engagement, enabling you to communicate your research effectively. With this template, you can confidently guide your audience through the intricacies of mixed methods research, fostering a deeper understanding of your findings and their real-world implications.
Features of the templates:
- 100% customizable slides and easy to download.
- Slides are available in different nodes & colors.
- The slide contained 16:9 and 4:3 formats.
- Easy to change the slide colors quickly.
- It is a well-crafted template with an instant download facility.


You May Also Like These PowerPoint Templates
Add to Wishlist
Download
AI Customize

Add to Wishlist
Download
AI Customize

Add to Wishlist
Download
AI Customize

Add to Wishlist
Download
AI Customize

Add to Wishlist
Download
AI Customize

Add to Wishlist
Download
AI Customize

Add to Wishlist
Download
AI Customize

Add to Wishlist
Download
AI Customize

Add to Wishlist
Download
AI Customize

Add to Wishlist
Download
AI Customize

Add to Wishlist
Download
AI Customize

Add to Wishlist
Download
AI Customize

Add to Wishlist
Download
AI Customize

Add to Wishlist
Download
AI Customize

Add to Wishlist
Download
AI Customize

Add to Wishlist
Download
AI Customize

Add to Wishlist
Download
AI Customize

Add to Wishlist
Download
AI Customize


Add to Wishlist
Download
AI Customize

Add to Wishlist
Download
AI Customize

Add to Wishlist
Download
AI Customize

Add to Wishlist
Download
AI Customize

Add to Wishlist
Download
AI Customize

Add to Wishlist
Download
AI Customize

Add to Wishlist
Download
AI Customize

Add to Wishlist
Download
AI Customize

Add to Wishlist
Download
AI Customize

Add to Wishlist
Download
AI Customize

Add to Wishlist
Download
AI Customize

Add to Wishlist
Download
AI Customize

Add to Wishlist
Download
AI Customize

Add to Wishlist
Download
AI Customize

Add to Wishlist
Download
AI Customize

Add to Wishlist
Download
AI Customize

Add to Wishlist
Download
AI Customize
