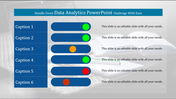
Simple Design Data Analytics PowerPoint Template Slide


Simple Analytical Template Presentation
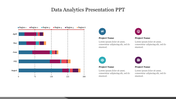
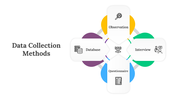
Analytics is the systematic computation-based analysis of data or statistics. This kind of Template will cover all relevant analogic, analytical, and analytical count themes. It is utilized for discovery. This PPT presentation conversation has an excellent magnifier design concept. White backgrounds draw in viewers and are attractive for title slide designs. These designs are suited for digital design and cutting-edge technical presentations as well. As an added benefit, there are simple editing and customization options. Grab it right away!
Features of the Template
- 100 % customizable slides and easy to download.
- Slides are available in different nodes & colors.
- The Slide contained 16:9 and 4:3 formats.
- Easy to change the slide colors quickly.
- It is a well-crafted template with an instant download facility.
- It is designed with a stunning theme design.
- Best Template for analytical Presentations.


You May Also Like These PowerPoint Templates
Add to Wishlist
Download
AI Customize

Add to Wishlist
Download
AI Customize

Add to Wishlist
Download
AI Customize

Add to Wishlist
Download
AI Customize

Add to Wishlist
Download
AI Customize

Add to Wishlist
Download
AI Customize

Add to Wishlist
Download
AI Customize

Add to Wishlist
Download
AI Customize

Add to Wishlist
Download
AI Customize

Add to Wishlist
Download
AI Customize

Add to Wishlist
Download
AI Customize

Add to Wishlist
Download
AI Customize

Add to Wishlist
Download
AI Customize

Add to Wishlist
Download
AI Customize

Add to Wishlist
Download
AI Customize

Add to Wishlist
Download
AI Customize

Add to Wishlist
Download
AI Customize

Add to Wishlist
Download
AI Customize

Add to Wishlist
Download
AI Customize

Add to Wishlist
Download
AI Customize
