Best Quality Data Analytics PowerPoint

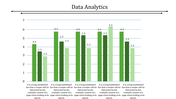
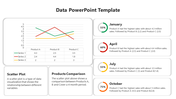

Data Analytics PPT Template
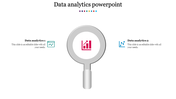
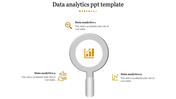
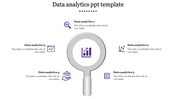
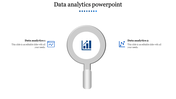
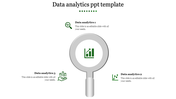
Data analysis is essential for making informed decisions and driving business growth. The Data Analytics PPT Template and Google Slides Themes are designed to simplify and enhance your data presentation needs. Featuring a central magnifying glass with a bar graph icon inside, this template is surrounded by five different icons, each with a caption text area, perfect for breaking down complex data points. Ideal for data analysts, business intelligence professionals, researchers, and educators, this template helps you present your findings clearly and effectively.
Use it in meetings, seminars, or educational settings to convey your data-driven insights with precision. Upgrade your presentations with the Data Analytics PPT Template and Google Slides Themes. Its structured design and visual appeal ensure your audience stays engaged and comprehends your data effortlessly. Transform your data presentations into compelling stories with this versatile and professional template.
Features of this template
- 100 % customizable slides are easy to download.
- Slides are available in different nodes and colors.
- The slide was contained in 16:9 and 4:3 formats.
- It is easy to change the slide colors quickly.
- Well-crafted template with an instant download facility.


You May Also Like These PowerPoint Templates
Add to Wishlist
Download
AI Customize

Add to Wishlist
Download
AI Customize

Add to Wishlist
Download
AI Customize

Add to Wishlist
Download
AI Customize

Add to Wishlist
Download
AI Customize

Add to Wishlist
Download
AI Customize

Add to Wishlist
Download
AI Customize

Add to Wishlist
Download
AI Customize

Add to Wishlist
Download
AI Customize

Add to Wishlist
Download
AI Customize

Add to Wishlist
Download
AI Customize

Add to Wishlist
Download
AI Customize

Add to Wishlist
Download
AI Customize

Add to Wishlist
Download
AI Customize

Add to Wishlist
Download
AI Customize

Add to Wishlist
Download
AI Customize

Add to Wishlist
Download
AI Customize

Add to Wishlist
Download
AI Customize

Add to Wishlist
Download
AI Customize

Add to Wishlist
Download
AI Customize
