Pareto Analysis Slide Presentation PowerPoint Template

PowerPoint slide for Pareto analysis with two circular diagrams showing reasons and complaints in percentages.
P.ID : 50847
    160 views
    17 Downloads
    Get Custom Slides by Experts
    Instantly Access Templates in PowerPoint

    Neat Pareto analysis template

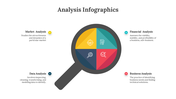
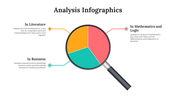
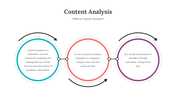
    Try this Pareto analysis PPT template for your compelling presentation. The template is creative, with two nodes designed in a circular format, which is highly useful. The nodes are user-friendly and can be edited at the user's convenience. Make important decisions using this fully customized template. Make quick and correct management decisions using this effective template. The text regarding the topic can be added to the node, making the explanation easier. Try to use this fantastic template and gain the audience effect. 
      

    Feature of the Template

    • 100% customizable slides
    • Easy to change the slide colors quickly.
    • It is easy to download.
    • Slides are available in different nodes & colors.
    • The slide contained 16:9 and 4:3 formats.
    • Well-crafted template with instant download facility.
    • Creative design with text area.
    Advertisement

    You May Also Like These PowerPoint Templates

    Add to Wishlist
    Download
    AI Customize
    Attractive Business Analytics PowerPoint Template Design
    Add to Wishlist
    Download
    AI Customize
    A person working on a laptop with analysis data, alongside bar charts with percentage and text box, on a gray background.
    Add to Wishlist
    Download
    AI Customize
    Analytics slide with line graph, pie chart, and statistics showing 13M views, 13M active subscribers, and 991K subscribers.
    Add to Wishlist
    Download
    AI Customize
    Analysis presentation slide showing a technology growth chart with percentage values and icons with placeholder text.
    Free
    Add to Wishlist
    Download
    AI Customize
    Best Scenario Analysis Presentation Template Slides
    Add to Wishlist
    Download
    AI Customize
    Analysis PPT slide with four colorful text boxes and unique icons for each stage of the process with captions.
    Add to Wishlist
    Download
    AI Customize
    Yellow pie chart divided into Analysis 1, 2, and 3 segments, focused by a black magnifying glass icon.
    Add to Wishlist
    Download
    AI Customize
    Graph with three numbered curves in green, orange, and red, with corresponding text on the right.
    Free
    Add to Wishlist
    Download
    AI Customize
    Blue themed slide with two square icons on tilted diamonds and two rectangular caption boxes on the right.
    Free
    Add to Wishlist
    Download
    AI Customize
    Analysis PPT slide showing a phone with a checklist and icons with multiple captions with text descriptions.
    Free
    Add to Wishlist
    Download
    AI Customize
    Circular analysis diagram featuring six purple sections with icons like a target and gear, arranged around a black bar chart.
    Free
    Add to Wishlist
    Download
    AI Customize
    Four triangular icons in yellow, pink, purple, and red, showing percentages, with gray caption boxes below.
    Add to Wishlist
    Download
    AI Customize
    Slide featuring a five step process for performance with matching icons for each phase.
    Free
    Add to Wishlist
    Download
    AI Customize
    Analysis presentation template with six sections arranged in a yellow circle, each featuring an icon and caption.
    Add to Wishlist
    Download
    AI Customize
    Analysis PowerPoint slide featuring a hexagonal internal analysis core and six colorful surrounding icons with labels.
    Add to Wishlist
    Download
    AI Customize
    Colorful pie chart with a man holding a pencil, surrounded by directional arrows, symbolizing analysis and decision making.
    Add to Wishlist
    Download
    AI Customize
    Slide deck featuring multiple analysis templates with colorful layouts, charts, and icons for data representation.
    Add to Wishlist
    Download
    AI Customize
    Performance template with four linked circles labeled from finance to business processes, each with bullet points and icons.