Get Involved Observation PowerPoint Template Design

Get Involved Observation PowerPoint Template Design
P.ID : 57159
    129 views
    16 Downloads
    Get Custom Slides by Experts
    Instantly Access Templates in PowerPoint

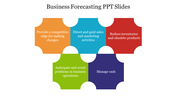
    Neat Observation PowerPoint template

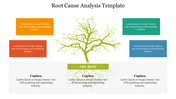
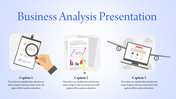
    Observation PowerPoint template is a beautiful template that can make the best outcome. The template can enhance the view of the presentation by adding user-friendly features.


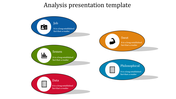
    The template is given with delicate nodes that are used for observation purposes. The template is given with multiple colors that can gain more attention from the audience. The template is added with a text area that can fill in the observations you have noted in a particular problem or a project.

    Since this template is fully customized, you will be able to make changes and the text in this specific area. Make sure to download this creative template and gain audience attention.

    Features of this template

    • This template is 100% editable.
    • 100% Customizable (shape color, size & text)
    • It supports an aspect ratio of 16:9.
    • Easily readable and acceptable template.
    • Five nodes with text area.
    Advertisement

    You May Also Like These PowerPoint Templates

    Add to Wishlist
    Download
    AI Customize
    Capabilities analysis template featuring color coded categories on the left and a circular percentage chart on the right.
    Add to Wishlist
    Download
    AI Customize
    Circular diagram with four segments in yellow, green, blue, and teal, each containing icons around a white central circle.
    Add to Wishlist
    Download
    AI Customize
    Use Performance PowerPoint And Google Slides Template
    Add to Wishlist
    Download
    AI Customize
    Illustration of a woman analyzing colorful bar and pie charts, with three color coded circular icons on the right.
    Add to Wishlist
    Download
    AI Customize
    Five numbered interconnected puzzle pieces in red, green, purple, teal, and blue, with human illustrations above.
    Add to Wishlist
    Download
    AI Customize
    Vibrant PESTLE chart dividing political, economic, social, technological, legal, and environmental aspects.
    Add to Wishlist
    Download
    AI Customize
    Analysis template with a man looking through a magnifying glass at a computer screen with four types and caption areas.
    Add to Wishlist
    Download
    AI Customize
    Step-by-step analysis diagram with a central focus on analysis, flanked by six green-highlighted steps.
    Add to Wishlist
    Download
    AI Customize
    Molecular-style infographic with interconnected colored nodes linked to six labeled captions for analysis ideas.
    Add to Wishlist
    Download
    AI Customize
    Central hexagonal shape with multicolor triangles around and two text areas with bar chart and coin stack with percentages.
    Add to Wishlist
    Download
    AI Customize
    Business Analytics slide featuring three stages with icons representing question, insight, and growth.
    Add to Wishlist
    Download
    AI Customize
    Data analysis template with a bar graph and illustrated dashboard layout with two caption areas for data.
    Add to Wishlist
    Download
    AI Customize
    Illustration of a person analyzing charts in blue accents, with four analysis types listed on the right.
    Add to Wishlist
    Download
    AI Customize
    Grid layout with five red boxes for why labels and three columns in blue, green, and purple for answers.
    Add to Wishlist
    Download
    AI Customize
    Four colorful vertical banners in yellow, red, blue, and green with icons, title, and descriptions for web analytics uses.
    Add to Wishlist
    Download
    AI Customize
    Data analysis featuring icons for data interpretation, market research, and performance evaluation.
    Add to Wishlist
    Download
    AI Customize
    Competitor analysis chart with four quadrants representing high and low price and quality, showing competitor circles.
    Free
    Add to Wishlist
    Download
    AI Customize
    Amazing Business Analytics PPT Templates and Google Slides
    Add to Wishlist
    Download
    AI Customize
     slide featuring three circular charts for data analysis, followed by a line chart displaying monthly trends.
    Add to Wishlist
    Download
    AI Customize
    Banking data analysis slide with green bar chart on a computer screen and three listed issues in circles on the right.