Detailed Analysis PowerPoint Presentation Download

 Canva
Canva

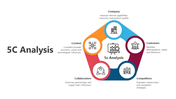


Analysis PowerPoint Presentation Down' template,
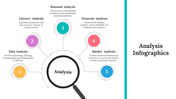
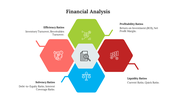
Imagine your presentation effortlessly coming to life with the 'Analysis PowerPoint Presentation Down' template, a sleek design featuring four interconnected nodes arranged in a dynamic arrow formation. Its professional shades of color exude confidence and sophistication, perfect for both creative endeavors and business settings. Seamlessly guiding your audience through complex data, this template streamlines the process of analysis, making information digestible and engaging. Whether you're unraveling market trends or showcasing project insights, the 'Data Analysis PowerPoint Template' serves as your trusted companion, transforming mundane data into impactful narratives. With its intuitive layout and captivating design, captivate your audience and leave a lasting impression with every slide.
Features of the template
- 100% customizable slides and easy to download.
- Slides are available in different nodes & colors.
- The slide contains 16:9 and 4:3 formats.
- Easy to change the colors of the slide quickly.
- Well-crafted template with an instant download facility.


You May Also Like These PowerPoint Templates
Add to Wishlist
Download
Edit

Add to Wishlist
Download
Edit

Add to Wishlist
Download
Edit

Add to Wishlist
Download
Edit

Add to Wishlist
Download
Edit

Add to Wishlist
Download
Edit

Add to Wishlist
Download
Edit

Add to Wishlist
Download
Edit

Add to Wishlist
Download
Edit

Add to Wishlist
Download
Edit

Add to Wishlist
Download
Edit

Add to Wishlist
Download
Edit


Add to Wishlist
Download
Edit

Add to Wishlist
Download
Edit

Add to Wishlist
Download
Edit

Showing20 of69,218 templates