Analytics PowerPoint Template And Google Slides Themes

Structured analytics template with blue visuals and pentagonal icons illustrating three data tracking elements.
P.ID : 23165
    16 slides
    Statistical analysis slides show stages with different colorful layout designs with detailed descriptions.
    11 slides
    GROW model colorful diagram PPT slides showing the stages with corresponding questions for each stage with layout design.
    13 slides
    Infographic detailing key phases of customer profitability analysis slide deck with icons and color-coded segments.
    176 views
    8 Downloads
    Get Custom Slides by Experts
    Instantly Access Templates in PowerPoint

    Best Analytics PowerPoint Template


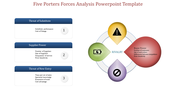
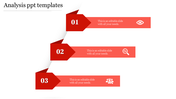
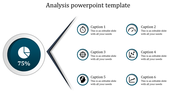
    Enhance your digital strategy with our comprehensive Analytics PowerPoint Template, featuring a calming blue color theme and three strategic options. Whether you're a marketer, web developer, or business owner, this template provides a visually engaging platform to delve into website performance metrics. Each option meticulously guides you through the analysis process, empowering you to uncover actionable insights that drive online success. Elevate your understanding and optimize your online presence with this dynamic template. Seize the opportunity to enhance your digital strategy! Download our Web Analytics PPT template now and gain valuable insights to propel your online initiatives. Let each slide guide you towards informed decisions and measurable results.


    Features of this template


    • 100% customizable slides and easy to download.
    • The slide contains 16:9 and 4:3 formats.
    • Easy to change the colors of the slide quickly.
    • Highly compatible with PowerPoint and Google Slides.
    Advertisement

    You May Also Like These PowerPoint Templates

    Add to Wishlist
    Download
    AI Customize
    Purple analytics PowerPoint template with sequentially numbered arrows, each with a different icon for key business metrics.
    Add to Wishlist
    Download
    AI Customize
    Innovative  PESTEL Analysis PowerPoint Template Slides
    Free
    Add to Wishlist
    Download
    AI Customize
    Engineer-focused slide with a figure in a yellow hard hat, flanked by green arrows denoting processes.
    Add to Wishlist
    Download
    AI Customize
    Colorful PESTLE analysis template with each section labeled for different business factors with placeholder text.
    Free
    Add to Wishlist
    Download
    AI Customize
    Timeline template showing a journey from 2016 to 2020 with icons for research, finance, analytics, intelligence, and success.
    Add to Wishlist
    Download
    AI Customize
    Social media icons with placeholder text and four colorful data icons on the right.
    Add to Wishlist
    Download
    AI Customize
    Results template showing research and analysis steps, with visual data on men and women in a company showings their earnings.
    Add to Wishlist
    Download
    AI Customize
    Business analysis bar chart slide with six colored bars representing different activities and percentages with text area.
    Add to Wishlist
    Download
    AI Customize
    A pack of slides with a colorful SCQA framework illustrating icons with visual charts and layouts.
    Add to Wishlist
    Download
    AI Customize
    The thematic analysis slide diagram shows the process from qualitative data to codes and themes in three colors.
    Add to Wishlist
    Download
    AI Customize
    Analysis PowerPoint Presentation And Google Slides Themes
    Free
    Add to Wishlist
    Download
    AI Customize
    Download Financial Analysis PowerPoint Presentation
    Add to Wishlist
    Download
    AI Customize
    Dupont analysis overview slides illustrating the calculation of profit margin with different layout designs with icons.
    Add to Wishlist
    Download
    AI Customize
    Current state analysis slide comparing cost reduction and value creation strategies with two colored boxes and text caption.
    Add to Wishlist
    Download
    AI Customize
    An infographic showing three stages of a research paradigm in red, orange and green in hexagon shape each with icons.
    Add to Wishlist
    Download
    AI Customize
    A reflective learning process slide shows four stages each in colorful boxes with text descriptions.