Predictive Analytics PowerPoint And Google Slides Templates

Pack of 11 slides
P.ID : 71470
Advertisement
801 views
115 Downloads
Get Custom Slides by Experts
Instantly Access Templates in PowerPoint

Predictive Analytics Presentation Slides


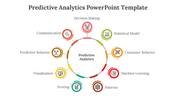
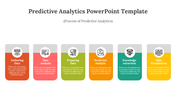
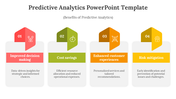
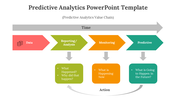
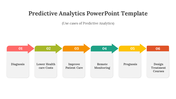
Predictive Analytics is an essential tool in modern data-driven decision-making. It harnesses historical data and advanced statistical techniques to forecast future trends, behaviors, and outcomes. With our Predictive Analytics PowerPoint, you can effectively communicate the significance of predictive analysis, diagnostic analysis, and prescriptive analysis to your audience. Tailored for data analysts, strategists, and decision-makers, this template simplifies complex concepts, making them accessible and actionable. Whether you're presenting sales forecasts, customer behavior predictions, or risk assessments, this resource equips you with customizable slides, editable charts, graphs, and diagrams to vividly illustrate your points. By using this template, you empower your audience to embrace data-driven decision-making, optimize strategies, improve operational efficiency, and gain a competitive edge. Harness the potential of predictive analytics and related analysis techniques with this versatile template and steer your organization toward data-driven success.


Features of the templates:


  • 100% customizable slides and easy to download.
  • Slides are available in different nodes & colors.
  • The slide contains 16:9 and 4:3 formats.
  • Easy to change the colors of the slide quickly.
  • Highly compatible with PowerPoint and Google Slides.
  • Well-crafted template with an instant download facility.

You May Also Like These PowerPoint Templates

Add to Wishlist
Download
AI Customize
Analysis PowerPoint template displaying a blue circular diagram with steps from interviewing stakeholders to building BPMN.
Add to Wishlist
Download
AI Customize
Analysis report template featuring a purple and green area graph comparing five projects, with separate information
Add to Wishlist
Download
AI Customize
Six oval elements in gray with icons and labels for analysis categories placed in white backdrop.
Add to Wishlist
Download
AI Customize
Modern design featuring a circular orange arc in the center, flanked by six numbered steps on curved paths on both sides.
Add to Wishlist
Download
AI Customize
Three vertical blocks in yellow, blue, and green, each with numbers and business analytics icons on a light background.
Add to Wishlist
Download
AI Customize
A pack of DESC model slides with four elements in various colorful layout designs with text descriptions.
Add to Wishlist
Download
AI Customize
Circular flowchart with colored arrows in blue, purple, orange, and yellow, pointing to icons and text areas beneath.
Add to Wishlist
Download
AI Customize
A PowerPoint slide featuring a magnifying glass focusing on data analysis with icons representing various analytics metrics.
Add to Wishlist
Download
AI Customize
Four step layout with colored tabs in orange, blue, green, and purple, featuring icons and white text boxes.
Add to Wishlist
Download
AI Customize
A strategic analysis format diagram with a triangle structure representing political, economic, and technological factors.
Add to Wishlist
Download
AI Customize
Square infographic with four curved arrows in blue, green, orange, and teal, arranged in a cycle for situation analysis.
Add to Wishlist
Download
AI Customize
Three colorful blocks labeled 01, 02, and 03, showcasing business analytics icons on a gradient background with captions.
Add to Wishlist
Download
AI Customize
Capability Gap PowerPoint And Google Slides Template
Add to Wishlist
Download
AI Customize
Structured analytics template with blue visuals and pentagonal icons illustrating three data tracking elements.
Add to Wishlist
Download
AI Customize
Professional PowerPoint slide showing a situation analysis diagram with color coded icons for different business processes.
Add to Wishlist
Download
AI Customize
Analytics PPT slide showing web analytics uses from traffic source analysis to conversion optimization with icons.
Add to Wishlist
Download
AI Customize
Market analysis slide featuring three sections from Analysis to Customer, with icons and a word cloud in a magnifying glass.
Add to Wishlist
Download
AI Customize
SWOT diagram with curved arrows in blue, purple, orange, and yellow, pointing to each quadrant.
Add to Wishlist
Download
AI Customize
Get Involved Observation PowerPoint Template Design
Add to Wishlist
Download
AI Customize
Analysis themed PowerPoint template with a colorful magnifying glass, document icon, and sections for captions.
Add to Wishlist
Download
AI Customize
Situational analysis slide, with color coded sections in orange, green, yellow, and blue, for external, internal, and issues.
Add to Wishlist
Download
AI Customize
Editable Performance PowerPoint And Google Slides Theme
Add to Wishlist
Download
AI Customize
Illustration of a boardroom meeting with presenting a bar graphs, and  three icons and captions on the right.
Add to Wishlist
Download
AI Customize
Magnifying glass with two speech bubbles on the left and four colored analysis sections with checkmark icons on the right.
Add to Wishlist
Download
AI Customize
Analytics PowerPoint slide with colorful bar charts, including icons for graphs, data analysis, and business targets.
Add to Wishlist
Download
AI Customize
Data analytics template with a magnifying glass in the center and six purple icons arranged around it.
Add to Wishlist
Download
AI Customize
Slide deck focusing on macro environment factors, using circular charts and colorful blocks for clarity.
Add to Wishlist
Download
AI Customize
A slide showing the colorful MOSCOW method for project priorities with each category labeled and described on a white theme.
Add to Wishlist
Download
AI Customize
Red and black diagram with a magnifying glass focusing on three analysis sections with icons inside.