Our Predesigned Market Analysis PowerPoint Template

Market analysis slide featuring three sections from Analysis to Customer, with icons and a word cloud in a magnifying glass.
P.ID : 26759
    16 slides
    Statistical analysis slides show stages with different colorful layout designs with detailed descriptions.
    11 slides
    GROW model colorful diagram PPT slides showing the stages with corresponding questions for each stage with layout design.
    13 slides
    Infographic detailing key phases of customer profitability analysis slide deck with icons and color-coded segments.
    277 views
    15 Downloads
    Get Custom Slides by Experts
    Instantly Access Templates in PowerPoint

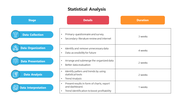
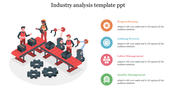
    Market Analysis PowerPoint Template and Google Slide


    Imagine downloading a captivating Market Analysis PowerPoint Template is like painting a canvas of insights and strategies, where each brushstroke represents a nuanced understanding of market dynamics. With a magnifying design, it meticulously zooms into market trends, competitor landscapes, and consumer behaviors. Utilizing three nodes – past, present, and future – it weaves a narrative that guides businesses toward informed decisions. Professional blue shades evoke trust and stability, infusing the presentation with a sense of reliability. This template isn't just a tool; it's a partner in conveying complex data with clarity and finesse. Similarly, for Market Research Presentation Templates, the emphasis is on deciphering the market's heartbeat, translating data into actionable insights. From brainstorming sessions to boardroom meetings, these templates serve as the backbone of creative presentations, empowering teams to visualize strategies and chart paths to success. In the dynamic arena of business, these templates stand as pillars of professionalism, ensuring that every presentation leaves a lasting impact.

    Features of the template

    • 100% customizable slides and easy to download.
    • Slides are available in different nodes & colors.
    • The slide contained 16:9 and 4:3 formats.
    • Easy to change the slide colors quickly.
    • Well-crafted template with instant download facility.
    Advertisement

    You May Also Like These PowerPoint Templates

    Add to Wishlist
    Download
    AI Customize
    Financial infographic with a yellow piggy bank and vertical upward arrows showing percentages and captions on both sides.
    Free
    Add to Wishlist
    Download
    AI Customize
    Circular diagram representing porter’s five forces with a central rivalry node linked to four external forces.
    Add to Wishlist
    Download
    AI Customize
    Purple analytics PowerPoint template with sequentially numbered arrows, each with a different icon for key business metrics.
    Add to Wishlist
    Download
    AI Customize
    Innovative  PESTEL Analysis PowerPoint Template Slides
    Free
    Add to Wishlist
    Download
    AI Customize
    Engineer-focused slide with a figure in a yellow hard hat, flanked by green arrows denoting processes.
    Add to Wishlist
    Download
    AI Customize
    Colorful PESTLE analysis template with each section labeled for different business factors with placeholder text.
    Free
    Add to Wishlist
    Download
    AI Customize
    Timeline template showing a journey from 2016 to 2020 with icons for research, finance, analytics, intelligence, and success.
    Add to Wishlist
    Download
    AI Customize
    Social media icons with placeholder text and four colorful data icons on the right.
    Add to Wishlist
    Download
    AI Customize
    Results template showing research and analysis steps, with visual data on men and women in a company showings their earnings.
    Add to Wishlist
    Download
    AI Customize
    Business analysis bar chart slide with six colored bars representing different activities and percentages with text area.
    Add to Wishlist
    Download
    AI Customize
    A pack of slides with a colorful SCQA framework illustrating icons with visual charts and layouts.
    Add to Wishlist
    Download
    AI Customize
    The thematic analysis slide diagram shows the process from qualitative data to codes and themes in three colors.
    Add to Wishlist
    Download
    AI Customize
    Analysis PowerPoint Presentation And Google Slides Themes
    Free
    Add to Wishlist
    Download
    AI Customize
    Download Financial Analysis PowerPoint Presentation
    Add to Wishlist
    Download
    AI Customize
    Dupont analysis overview slides illustrating the calculation of profit margin with different layout designs with icons.
    Add to Wishlist
    Download
    AI Customize
    Current state analysis slide comparing cost reduction and value creation strategies with two colored boxes and text caption.
    Add to Wishlist
    Download
    AI Customize
    An infographic showing three stages of a research paradigm in red, orange and green in hexagon shape each with icons.