Download Analysis PPT Templates and Google Slides Themes

Circular segmented chart in blue, green, and orange with four captions and icons on a textured gray background.
P.ID : 15459
    16 slides
    Customer Value Proposition triangle diagram PPT slides with different layout designs and icons with text descriptions.
    16 slides
    A pack of slides with a colorful SCQA framework illustrating icons with visual charts and layouts.
    13 slides
    Analysis PowerPoint Presentation And Google Slides Themes
    11 slides
    Dupont analysis overview slides illustrating the calculation of profit margin with different layout designs with icons.
    256 views
    7 Downloads
    Get Custom Slides by Experts
    Instantly Access Templates in PowerPoint

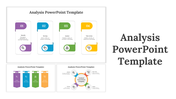
    Unlock Insights with Analysis PPT Templates


    Wondering how to present your analysis findings effectively? Our Analysis PPT Templates and Google Slides Themes are here to help!

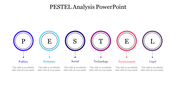
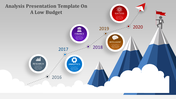
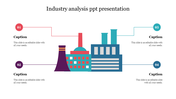
    This template features four colorful circles, each representing a key aspect of your analysis. Within each circle, you'll find an icon, a caption, and a text area, allowing you to articulate your findings with clarity and precision. With a vibrant multicolor theme, your presentation will be visually engaging and easy to understand.

    Perfect for analysts, consultants, researchers, and educators, our analysis template helps you communicate complex data clearly and concisely. Whether you're presenting market analysis, financial reports, or research findings, this template will elevate your presentations and impress your audience.

    Features of the template


    • 100% customizable slides are easy to download.
    • Slides are available in different colors.
    • The slide has 4:3 and 16:9 formats.
    • It is easy to change the slide colors quickly.
    • It has a cute design to impress an audience.
    • Create feature-rich, animated presentations.
    Advertisement

    You May Also Like These PowerPoint Templates

    Add to Wishlist
    Download
    AI Customize
    An infographic showing three stages of a research paradigm in red, orange and green in hexagon shape each with icons.
    Add to Wishlist
    Download
    AI Customize
    A reflective learning process slide shows four stages each in colorful boxes with text descriptions.
    Add to Wishlist
    Download
    AI Customize
    Grid of various plot diagram slides showcasing narrative arcs, with labels for different stages of a plot's progression.
    Add to Wishlist
    Download
    AI Customize
    RCA diagram with a gray section and four colored text box in orange, purple, blue, and yellow on the right.
    Add to Wishlist
    Download
    AI Customize
    Simple Moscow Method PowerPoint Slide Template
    Add to Wishlist
    Download
    AI Customize
    Five-segment RATER model with colored circles representing service quality factors and placeholder text around each
    Add to Wishlist
    Download
    AI Customize
    Slide deck showcasing ratio analysis elements with colorful geometric designs and icons, highlighting financial metrics.
    Add to Wishlist
    Download
    AI Customize
    Slide illustrating win and loss analysis with red and green arrows along with four key step icons and text descriptions.
    Add to Wishlist
    Download
    AI Customize
    Slide deck covering hypothesis testing, with a central six-step process diagram and supporting slides in a white background.
    Add to Wishlist
    Download
    AI Customize
    3C analysis slides with various triangle shaped layouts in vibrant colors representing company, customers, and competitors.
    Add to Wishlist
    Download
    AI Customize
    VRIO table in red and orange hues, featuring rows for value, rare, inimitable, and organized with yes and no in columns.