Plot Diagram — Edit and Present

Plot Diagram — PowerPoint and Google Slides Template
Spending hours building slides from scratch is time you don't have. A ready-made, fully editable template gets you to a polished presentation in minutes — not hours.
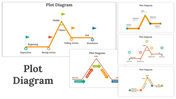
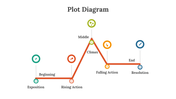
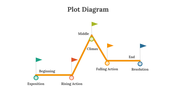
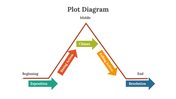
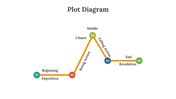
This Plot Diagram gives you a fully editable slide deck that's ready to use the moment you download it. The slide features grid of various plot diagram slides showcasing narrative arcs, with labels for different stages of a plot's progression. Drop it into your deck, replace the placeholder text, and you're done.
What's Inside
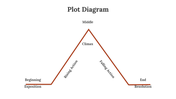
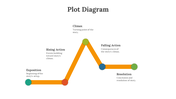
Multiple professionally designed slides — each one fully editable from text to icons to color scheme — text, colors, icons, and layout are all yours to adjust. Design variations include: Plot structure, Elements of a plot diagram, Plot Pyramid Shape, Plot Chart. Match your brand, adapt the layout, change the colors — it takes minutes, not hours.
Who This Is For
Built for professionals, students, educators, and anyone who needs a polished, ready-to-use presentation template. No design background needed — just open, edit, and present.
Formats & Download
Available for PowerPoint and Google Slides. Download instantly — no design skills required. Everything is fully customizable to match your brand or topic.
Key Features
- Fully editable — text, colors, icons, and layout
- Compatible with PowerPoint and Google Slides
- 16:9 widescreen format — presentation-ready
- Clean, professional design — no clutter
- Premium — instant download access
Explore more Analysis PowerPoint slides to find the right fit for your next presentation.


You May Also Like These PowerPoint Templates


