Pie Chart PowerPoint Presentation Template and Google Slides

Pie chart slide showing three charts for geographic, business segment, and product with a text area.
P.ID : 32032
    813 views
    53 Downloads
    Get Custom Slides by Experts
    Instantly Access Templates in PowerPoint

    Pie Chart Presentation Slide

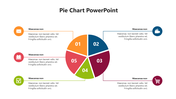
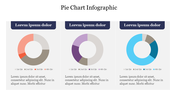
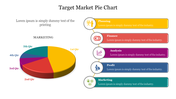
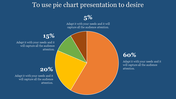
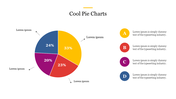
    A pie chart is a visual representation of data that is used to display proportions or percentages. The chart is divided into segments, with each segment representing a different category or value. Pie charts are an effective way to illustrate the relationship between different data points. You can use this presentation if you want to explain this idea to your audience.
     

    Feature of the template:

    • 100% customizable slide and easy to download.
    • The slide contained 16:9 and 4:3 format.
    • Well-crafted template with an instant download facility.
    • Highly compatible with PowerPoint and Google Slides.
    • This slide has a colorful design pattern.
    • Easy to change the slide colors.
    Advertisement

    You May Also Like These PowerPoint Templates

    Add to Wishlist
    Download
    AI Customize
    A 3D pie chart in yellow, red, blue, and pink sections on a gradient gray background with captions around it.
    Add to Wishlist
    Download
    AI Customize
    Pie chart slide showing budget distribution for facebook, google, and linkedIn ads with respective percentages.
    Add to Wishlist
    Download
    AI Customize
    Three pie charts in brown, blue, and green sections, each with labeled percentages and caption lines.
    Free
    Add to Wishlist
    Download
    AI Customize
    Multicolored circular pie chart in yellow, red, and green, with labeled categories listed on the right.
    Add to Wishlist
    Download
    AI Customize
    Chart maker slide with a 3D pie chart labeled for each quarter and four editable text boxes on the right side.
    Add to Wishlist
    Download
    AI Customize
    Four segmented doughnut charts in yellow, red, purple, and blue with black circular labels, percentage values, and captions.
    Free
    Add to Wishlist
    Download
    AI Customize
    Colorful pie chart slide showing five segments with percentages, paired with four content boxes for additional information.
    Add to Wishlist
    Download
    AI Customize
    Microsoft PowerPoint slide featuring three donut charts in yellow, orange, and pink, each with different percentage values.
    Add to Wishlist
    Download
    AI Customize
    Slide featuring a blue-toned pie chart representing sales revenue percentages, with captions areas for each segment.
    Add to Wishlist
    Download
    AI Customize
    Row of pie charts with varying color schemes for data visualization each place diwth caption areas.
    Add to Wishlist
    Download
    AI Customize
    Three pie charts in red, yellow, and blue with percentage values, arranged horizontally with text below.
    Free
    Add to Wishlist
    Download
    AI Customize
    A circular pie chart in blue and orange at the center, flanked by two rectangular sections with icons and text details.
    Add to Wishlist
    Download
    AI Customize
    Five segment pie chart in orange, blue, red, green, and pink, each with number and connected with text areas.
    Add to Wishlist
    Download
    AI Customize
    Colorful custom pie chart slide displaying three segments with percentages along with caption placeholders.
    Add to Wishlist
    Download
    AI Customize
    Three circular progress charts in red, teal, and yellow, with percentage levels, displayed on a black rectangular box.
    Add to Wishlist
    Download
    AI Customize
    A pie chart featuring five segments, each labeled with percentages, surrounded by text on a blue background.
    Add to Wishlist
    Download
    AI Customize
    Dark themed layout featuring four pie charts with shaded segments, each displaying different percentages.