Innovative Demographic Presentation PowerPoint Slide Design

Demographic chart with colored figures and five horizontal bars, displaying percentage breakdowns by project.
P.ID : 44154
    519 views
    37 Downloads
    Get Custom Slides by Experts
    Instantly Access Templates in PowerPoint

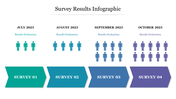
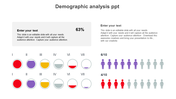
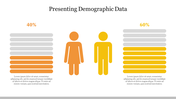
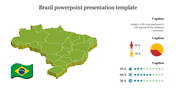
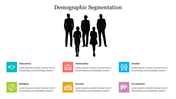
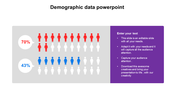
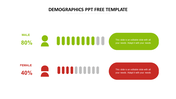
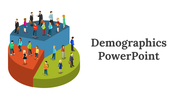
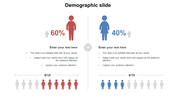
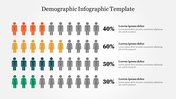
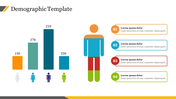
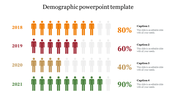
    Exhibit your Demographics Data

    What population and why should you care? It's essential to have an accurate picture of your target audience to make marketing decisions. As demographic data becomes more accessible, brands have become increasingly sophisticated with their marketing efforts. Demographics PPT Slide is here to convey your analysis of data related to the public, like age, population, gender, marital status, education, and so on. It is handy for marketing and business PPTs. It is crafted with a creative table, icons, and four nodes for various data analyses. Make elegant PPTs in a flash with our slide.

    Features of the template:

    • 100% customizable slides and easy to download.
    • Slides are available in different nodes & colors.
    • The slide contained 16:9 and 4:3 formats.
    • Easy to change the slide colors quickly.
    • Well-crafted template with an instant download facility.
    • Vivid human icons added.
    Advertisement

    You May Also Like These PowerPoint Templates

    Add to Wishlist
    Download
    AI Customize
    Chart with blue and orange bars representing male and female demographics, along with icons for each gender.
    Add to Wishlist
    Download
    AI Customize
    Demography PowerPoint template showcasing percentages with colored figures representing data and placeholder text.
    Free
    Add to Wishlist
    Download
    AI Customize
    Market segmentation template with two sections, each featuring a row of figures representing in various colors.
    Add to Wishlist
    Download
    AI Customize
    Survey results template featuring percentages and icons, with 80% represented visually in a red block on the right.
    Add to Wishlist
    Download
    AI Customize
    Demographic layout with colored person icons in red and blue, linked with captions and percentage values.
    Add to Wishlist
    Download
    AI Customize
    Demographic business strategy infographic slide featuring seven key business areas and an icon representing growth.
    Add to Wishlist
    Download
    AI Customize
    Slide showing demographic statistics with orange and pink person icons on either side of a gray shield graphic.
    Add to Wishlist
    Download
    AI Customize
    Slide comparing two demographic segments, A and B, with gender icons and corresponding bar charts for three steps.
    Add to Wishlist
    Download
    AI Customize
    Layout showing blue and red blocks with percentages, a central figure, and step circles for demographic data visualization.
    Add to Wishlist
    Download
    AI Customize
    Demographic PPT presentation slide with four colorful circular sections labeled A, B, C, and D, each with placeholder text.
    Add to Wishlist
    Download
    AI Customize
    Demographics PowerPoint Template Presentation Slide
    Add to Wishlist
    Download
    AI Customize
    Demographic infographic displaying the population of the USA in 2018 by age group and gender, with male and female sections.
    Add to Wishlist
    Download
    AI Customize
    Hexagonal diagram with six colored sections, featuring male and female icons, with numbered labels and captions.
    Add to Wishlist
    Download
    AI Customize
    Demographics based PPT slide featuring maps of the United States and Brazil with gender distribution icons and percentages.
    Add to Wishlist
    Download
    AI Customize
    Grab dazzling Demographics PPT Free Template presentation
    Add to Wishlist
    Download
    AI Customize
    Slide with three colorful human icons representing proportions, with circular percentages and text on the brown sidebar.