Affordable Chart Presentation Template With Two Node

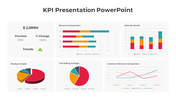
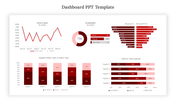
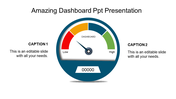
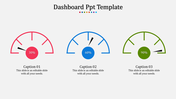
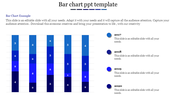
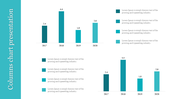
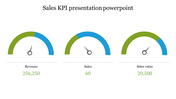
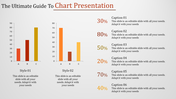
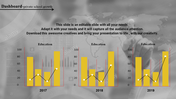
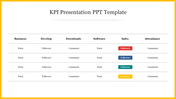
Chart PowerPoint Template and Google Slides Themes
Experience the power of Chart PowerPoint Template and Google Slides Themes. This template features three dynamic nodes, each with captions, titles, and text areas. Ideal for data analysts, marketers, and educators, it brings clarity to trends and comparisons. Say goodbye to dull slides and welcome engaging storytelling. Craft professional presentations effortlessly with our user-friendly interface. Elevate your content and captivate your audience. Download now to revolutionize your data presentations!
Features of the Template
- 100 % customizable slides.
- The slide show is in 4:3, 16:9, zip format.
- There is powerful connectivity with Google Slides and PowerPoint.
- It is simple and quick to alter the slide's color.
- An efficient template that can be easily accessed immediately.
- Well-crafted template with an instant download facility.


You May Also Like These PowerPoint Templates

Add to Wishlist
Download
Edit

Add to Wishlist
Download
Edit


Add to Wishlist
Download
Edit


Add to Wishlist
Download
Edit


Add to Wishlist
Download
Edit

Add to Wishlist
Download
Edit

Add to Wishlist
Download
Edit


Add to Wishlist
Download
Edit

Add to Wishlist
Download
Edit

Add to Wishlist
Download
Edit


Add to Wishlist
Download
Edit
