Finance Presentation Templates and Themes

Finance template with a bar chart detailing yearly production and sales data, layered over a vehicle image.
P.ID : 33883
    262 views
    13 Downloads
    Get Custom Slides by Experts
    Instantly Access Templates in PowerPoint

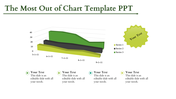
    Finance Dynamics: PowerPoint Template and Google Slides Themes


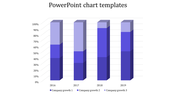
    Experience the evolution of financial presentation with our Finance Dynamics PowerPoint Template and Google Slides Themes. This cutting-edge template boasts year-wise graph representations from 2013 to 2019, complete with captions, a title holder, and an expansive text area for in-depth analysis.

    Whether you're a seasoned financial analyst crunching numbers, a consultant crafting strategic reports, or an educator imparting financial wisdom, this template is your go-to tool. Designed for the discerning finance professional, it offers a seamless blend of data and narrative, ensuring your insights resonate with impact.

    Improve your presentations, captivate your audience, and let your financial story unfold effortlessly. Download Finance Dynamics today and transform your data into compelling narratives.

    Features of the Template

    • 100 % customizable slides.
    • The   slide show is in 4:3, 16:9, zip format.
    • There is powerful connectivity with Google Slides and PowerPoint.
    • It is simple and quick to alter the slide's color.
    • An efficient template that can be easily accessed immediately.
    • Well-crafted template with an instant download facility.
    Advertisement

    You May Also Like These PowerPoint Templates

    Add to Wishlist
    Download
    AI Customize
    3D triangular bar chart in yellow, orange, and blue shades showing monthly data for four categories, on a dark background.
    Free
    Add to Wishlist
    Download
    AI Customize
    A simple chart slide with overlaid blue, green, orange, and yellow circles of varying sizes with a graph and captions.
    Add to Wishlist
    Download
    AI Customize
    Gantt chart PowerPoint template showing a timeline for multiple targets across January, February, and March, with milestones.
    Add to Wishlist
    Download
    AI Customize
    Bar chart slide showcasing yearly data from 2016 to 2021, with three distinct bar categories and values in shades of purple.
    Add to Wishlist
    Download
    AI Customize
    Bar chart slide with colorful conical graphs representing different categories, accompanied by labeled captions and icons.
    Add to Wishlist
    Download
    AI Customize
    3D cone chart with orange, pink, and blue segments, placed on a gray platform with a white background.
    Add to Wishlist
    Download
    AI Customize
    Bar chart slide showing the performance of four products with categories like sales growth, market share, and profit margin.
    Add to Wishlist
    Download
    AI Customize
    A creative PPT slide design featuring four stages from initiation to execution, each with icons and colorful segments.
    Add to Wishlist
    Download
    AI Customize
    Slide displaying two pie charts with quarter wise performance data, along with performance percentages at the bottom.
    Add to Wishlist
    Download
    AI Customize
    Dashboard layout showing net worth value, asset categories in a pie chart, and bar chart for real estate comparisons.
    Add to Wishlist
    Download
    AI Customize
    PowerPoint slide showcasing a chart with project status trends and a progress bar for each year.
    Add to Wishlist
    Download
    AI Customize
    Slide featuring three green pie charts and a line graph below, illustrating data trends for different categories.
    Add to Wishlist
    Download
    AI Customize
    Four panel chart slide featuring a line, bar, and pie chart, each displaying data trends and comparisons.
    Free
    Add to Wishlist
    Download
    AI Customize
    Green bar graph depicting growth over six months, with two gear icons and captions on the left.
    Add to Wishlist
    Download
    AI Customize
    Slide featuring a 3D bar graph with three series on dark backdrop, a green star shaped badge, and text boxes below.
    Add to Wishlist
    Download
    AI Customize
    Project dashboard slide with a compass design,  featuring four labeled captions, and an orange sidebar for text.
    Add to Wishlist
    Download
    AI Customize
    Donut chart showing sales distribution across four quarters with blue, orange, gray, and yellow segments.
    Free
    Add to Wishlist
    Download
    AI Customize
    Chart slide with four interlinked circular diagrams, and two radar charts in blue and green at the bottom.