Editable Chart Presentation PPT And Google Slides

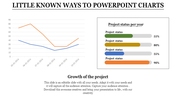
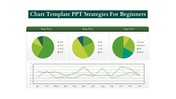
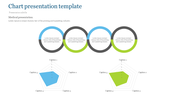
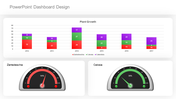
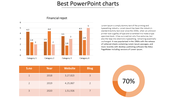
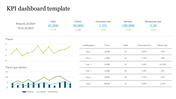
Chart Presentation Template
Use appropriate information to keep your audience engaged, by introducing the Chart Presentation PPT And Google Slides Template. The slide has an area chart diagram with five sets of values. It provides a complete representation of data trends over time. Below the graph, three text boxes are available for adding detailed explanations.
Ideal for data analysts, business executives, financial planners and educators. Suitable for showcasing quarterly growth, comparing datasets or illustrating statistical trends. Download now to create an understandable format.
Features of the template
- The slide contains 16:9 and 4:3 formats.
- Compatible with Google slide themes and PowerPoint.
- 100% customizable slides and easy to download.
- It is easy to change the colors of the slide quickly.
- Well-crafted template with an instant download facility.


You May Also Like These PowerPoint Templates
Add to Wishlist
Download
AI Customize

Add to Wishlist
Download
AI Customize

Add to Wishlist
Download
AI Customize

Add to Wishlist
Download
AI Customize

Add to Wishlist
Download
AI Customize

Add to Wishlist
Download
AI Customize

Add to Wishlist
Download
AI Customize

Add to Wishlist
Download
AI Customize

Add to Wishlist
Download
AI Customize

Add to Wishlist
Download
AI Customize


Add to Wishlist
Download
AI Customize

Add to Wishlist
Download
AI Customize

Add to Wishlist
Download
AI Customize

Add to Wishlist
Download
AI Customize

Add to Wishlist
Download
AI Customize

Add to Wishlist
Download
AI Customize

Add to Wishlist
Download
AI Customize

Add to Wishlist
Download
AI Customize

Add to Wishlist
Download
AI Customize
