Free - Slide Chart for Data-Driven Teams

Free
Six charts in different formats, including line, pie, bar, and gauge, all in blue and gray, displaying data trends.
P.ID : 62316
    13.5K+ views
    6.6K+ Downloads
    Get Custom Slides by Experts
    Enhance Your Presentations with Add-ins
    Google Slides Add-in
    Access templates directly in Google Slides
    Microsoft PowerPoint Add-in
    Access templates directly in PowerPoint
    GPT Add-on
    AI-powered presentation assistance

    Slide Chart — PowerPoint and Google Slides Template


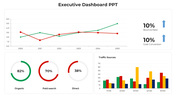
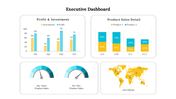
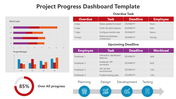
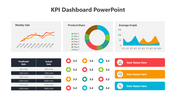
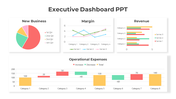
    Dashboards packed with raw numbers lose the room. A structured visual layout guides attention to the metrics that matter — and makes decisions easier.


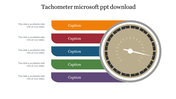
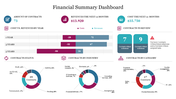
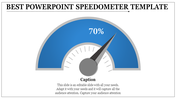
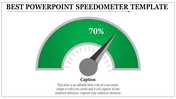
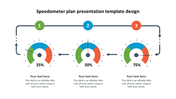
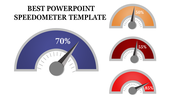
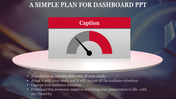
    This Slide Chart gives you a clean, fully editable presentation slide that's ready to use the moment you download it. The slide features six charts in different formats, including line, pie, bar, and gauge, all in blue and gray, displaying data trends. Drop it into your deck, replace the placeholder text, and you're done.


    What's Inside


    A focused single-slide design — built for one strong visual message, fast to customize — text, colors, icons, and layout are all yours to adjust. Design variations include: Chart, Chart Diagram, Chart And Graphs, Chart Infographics. Match your brand, adapt the layout, change the colors — it takes minutes, not hours.


    Who This Is For


    Built for analysts, business intelligence teams, executives, and managers presenting performance data in a clear, visual format. No design background needed — just open, edit, and present.


    Formats & Download


    Available for PowerPoint and Google Slides. Download free — no account needed. Open it in your preferred app and start editing right away.


    Key Features


    • Fully editable — text, colors, icons, and layout
    • Compatible with PowerPoint and Google Slides
    • 16:9 widescreen format — presentation-ready
    • Clean, professional design — no clutter
    • Free — instant download access

    Explore more Dashboard PowerPoint templates to find the right fit for your next presentation.


    Related collections: Market analysis templates | Business plan templates

    Advertisement

    You May Also Like These PowerPoint Templates

    Add to Wishlist
    Download
    AI Customize
    Dashboard slide showing plant growth data with details table and area chart for Zantedeschia, Celosia, and Calendula.
    Add to Wishlist
    Download
    AI Customize
    Colorful Tachometer slide with color coded sections from light to BMI with placeholder text.
    Add to Wishlist
    Download
    AI Customize
    Slide with three tachometer dials in blue, purple, and pink, each aligned above a matching caption box.
    Add to Wishlist
    Download
    AI Customize
    Dashboard graphics displaying vehicle speeds with a data table listing vehicles, brands, and status.
    Add to Wishlist
    Download
    AI Customize
    Project dashboard slides with Gantt chart, a burndown chart, and a timeline, using a palette of brown, green, and red.
    Add to Wishlist
    Download
    AI Customize
    Tachometer PowerPoint slide with gauges indicating 10, 20, and 30 with captions for each.
    Add to Wishlist
    Download
    AI Customize
    Concentric pentagons in black with text areas around each corner, forming a simple monochrome layout.
    Add to Wishlist
    Download
    AI Customize
    Horizontal infographic with four tachometer icons in gradient colors, labeled with captions for each gauge.
    Add to Wishlist
    Download
    AI Customize
    Slide featuring a tachometer dial with four performance levels and linked captions in red, yellow, maroon, and blue.
    Add to Wishlist
    Download
    AI Customize
    Dashboard layout with charts in orange tones, including a donut chart, bar graphs, and a line chart for monthly data.
    Add to Wishlist
    Download
    AI Customize
    Slide with four red speedometers, each indicating a different percentage level, against a white background.
    Add to Wishlist
    Download
    AI Customize
    Blue themed dashboard layout with a line chart, two growth metrics, and three semi circle gauges for budget.
    Free
    Add to Wishlist
    Download
    AI Customize
    Circular speedometer with orange and gray segments, displaying kilometer markings from 5.5 KM to 8 KM.
    Free
    Add to Wishlist
    Download
    AI Customize
    Dashboard graphic featuring a circular speedometer with a red needle, surrounded by text labels for various business metrics.