MILESTONE 🌟 5 Million+ creative minds trust SlideEgg! Grab 80% OFF

Find The Best Collection Of Chart PowerPoint Template

Infographic featuring a diamond-shaped chart with numbered levels and caption boxes on each side.
P.ID : 13491
    177 views
    6 Downloads
    Get Custom Slides by Experts
    Enhance Your Presentations with Add-ins
    Google Slides Add-in
    Access templates directly in Google Slides
    Microsoft PowerPoint Add-in
    Access templates directly in PowerPoint
    GPT Add-on
    AI-powered presentation assistance

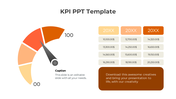
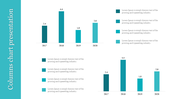
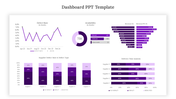
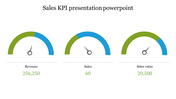
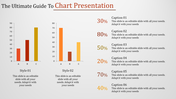
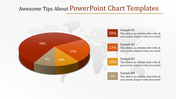
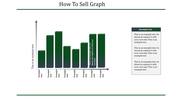
    Chart Presentation Template


    Create an Engaging presentation with our Chart PowerPoint template.

    This slide is a masterpiece. The red backdrop exudes professionalism, while the white pyramid chart takes center stage. Each level represents a step toward success, from foundational knowledge to mastery. But here’s the magic: every element is editable. Need to tweak the labels? No problem. Want to adjust the colors to match your brand? Easy. It’s your canvas; create your masterpiece.

    Who Can Benefit?

    Professionals: Whether you’re a marketing guru, financial analyst, or project manager, these charts simplify complex concepts. Use them in client presentations, board meetings, or training sessions.
    Students: Ace that class presentation with confidence. Our charts make data engaging, so you’ll leave a lasting impression on your professors and peers.

    Why Choose Our template?

    1. Ease of Use: No steep learning curve. Just plug and play.
    2. Customization: Tailor each slide to your content.

    Explore our collection and download your secret weapon today. Success awaits!

    Features of the template:

    •  Slides are available in 4:3 & 16:9
    • Get slides that are 100% customizable and easy to download
    • Highly compatible with PowerPoint and Google Slides.
    Advertisement

    You May Also Like These PowerPoint Templates

    Free
    Add to Wishlist
    Download
    AI Customize
    Dashboard template with a circular speedometer gauge in the center, divided into five blue segments labeled 01 to 05.
    Add to Wishlist
    Download
    AI Customize
    Stacked bar chart with four vertical bars showing percentages from 2013, 2014, and 2015 in varying green shades.
    Add to Wishlist
    Download
    AI Customize
    Project timeline Gantt chart with color coded bars indicating task descriptions, assigned resources, and milestone markers.
    Add to Wishlist
    Download
    AI Customize
    PPT slide displaying various charts including bar charts, pie charts, calendars, and Gantt charts for project tracking.
    Free
    Add to Wishlist
    Download
    AI Customize
    KPI dashboard bar chart slide representing the height of the world's tallest hills with a world map marking their locations.
    Free
    Add to Wishlist
    Download
    AI Customize
    Dashboard infographic with three gauge meters in blue, green, and yellow, each labeled with a number and caption.
    Add to Wishlist
    Download
    AI Customize
    KPI dashboard slide with line chart, showing performance for four categories, along with circular percentage indicators.
    Add to Wishlist
    Download
    AI Customize
    PPT chart with five colorful percentage indicators displayed in curved circular segments, ranging from 30 to 70 percent.
    Add to Wishlist
    Download
    AI Customize
    Speedometer KPI dashboard showing speed readings for three vehicles a truck, a van, and a car.
    Free
    Add to Wishlist
    Download
    AI Customize
    Visual layout of various charts, including area and bar graphs, arranged in a grid format with caption areas.
    Add to Wishlist
    Download
    AI Customize
    KPI dashboard PowerPoint slide showing a bar chart with active accounts for different categories and percentage indicators.
    Add to Wishlist
    Download
    AI Customize
    Template showcasing various chart designs, including line, bar, pie, and comparison charts across multiple slides.
    Add to Wishlist
    Download
    AI Customize
    Six panel infographic featuring KPI metrics with colorful charts, graphs, and numerical data insights.
    Add to Wishlist
    Download
    AI Customize
    Creative charts showing a circular 60% approval metric, bar graphs, and a 55% Twitter engagement donut chart.
    Free
    Add to Wishlist
    Download
    AI Customize
    Gantt chart plan template showing tasks across months with a colorful circular pie chart and matching bars on theright.
    Add to Wishlist
    Download
    AI Customize
    Financial highlights slide with bar chart and circular gauges tracking sales, operating income, and expenses.
    Add to Wishlist
    Download
    AI Customize
    Project schedule slide with a Gantt chart displaying tasks, timelines, and completion percentages.
    Free
    Add to Wishlist
    Download
    AI Customize
    Dashboard with line graphs, a circular chart with three segments, and labeled financial metrics, in red, orange, and green.
    Add to Wishlist
    Download
    AI Customize
    Dashboard slide showing Zantedeschia, Celosia, and Calendula growth data with a bar chart from 2012 to 2017.
    Add to Wishlist
    Download
    AI Customize
    A dashboard style slide showing plant growth data for Zantedeschia, Celosia, and Calendula with gauge charts and a bar graph.