MILESTONE 🌟 5 Million+ creative minds trust SlideEgg! Grab 80% OFF

Awesome Chart PowerPoint Presentation Template Design

Chart PPT template showing graphs for revenue, expenses, and earnings before interest and taxes across three categories.
P.ID : 34189
    185 views
    9 Downloads
    Get Custom Slides by Experts
    Enhance Your Presentations with Add-ins
    Google Slides Add-in
    Access templates directly in Google Slides
    Microsoft PowerPoint Add-in
    Access templates directly in PowerPoint
    GPT Add-on
    AI-powered presentation assistance

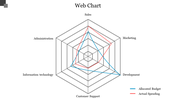
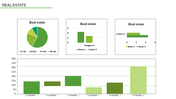
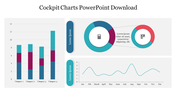
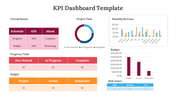
    Chart Presentation Template


    Optimize the Power of Data Visualization with Our Chart PowerPoint Template.

    The Slide: A Symphony of Data

    A slide that seamlessly blends form and function. At the top, an elegant line chart dances across the canvas, tracing the delicate balance between “Revenue” and “Expenses.” Each curve tells a story, each marker a critical point in your financial journey. Below it, a vibrant bar graph bursts forth, vivid colors representing different expense categories. It’s not just data; it’s a symphony of insights.

    Who Can Benefit?

    Professionals: Whether you’re a seasoned executive or a budding analyst, these templates are your secret weapon. Impress clients, dazzle colleagues, and elevate your presentations to a whole new level.
    Anyone: Maybe you’re a startup founder pitching to investors or a nonprofit leader advocating for change. These templates are your allies. They transform raw numbers into persuasive narratives, leaving a lasting impression.

    How to Use?

    Input Your Data: Open the template, and replace the placeholders with your actual data. Our intuitive design ensures you won’t get lost in the process.

    Click and download to explore our chart PowerPoint template

    Features of the template:

    •  Slides are available in 4:3 & 16:9
    • Well-crafted template with instant download.
    • Get slides that are 100% customizable and easy to download
    Advertisement

    You May Also Like These PowerPoint Templates

    Add to Wishlist
    Download
    AI Customize
    Two line graphs comparing data trends with different colors, featuring seven data points on each chart.
    Add to Wishlist
    Download
    AI Customize
    Colorful circle chart depicting percentage distribution across four categories, with accompanying captions for each segment.
    Add to Wishlist
    Download
    AI Customize
    Colorful business analytics dashboard displaying bar graphs, line charts, and percentage indicators in a structured layout.
    Add to Wishlist
    Download
    AI Customize
    Stacked column chart with three categories, percentage labels, and circular step icons on both sides with percentage figures.
    Add to Wishlist
    Download
    AI Customize
    A stock chart with five vertical bars in orange and teal, representing financial data for a day period.
    Add to Wishlist
    Download
    AI Customize
    Line chart with labeled high and low points across a fluctuating path, illustrating peaks and troughs in data trends.
    Add to Wishlist
    Download
    AI Customize
    Dashboard layout with income, expenses, profit, and cash flow figures on the left, a project budget chart in the center.
    Add to Wishlist
    Download
    AI Customize
    Dashboard template with pink charts showing facebook and twitter activity, percentage rings, and a page growth graph.
    Add to Wishlist
    Download
    AI Customize
    Line chart template with two lines and labeled data points, along with caption blocks on the left.
    Add to Wishlist
    Download
    AI Customize
    A green circular pie chart showing percentage, and four colored sales data graphs for different years.
    Add to Wishlist
    Download
    AI Customize
    A line graph showing a plot structure with key points marked by colored dots, representing key stages.
    Add to Wishlist
    Download
    AI Customize
    SEO marketing plan template with icons representing different elements like e-commerce, email, and global marketing.
    Add to Wishlist
    Download
    AI Customize
    A donut chart with multiple segments in different colors next to a table displaying statistics and percentage changes.
    Free
    Add to Wishlist
    Download
    AI Customize
    Slide deck showcasing KWL chart layouts with colorful sections in purple, yellow, and teal, for structured insights.
    Add to Wishlist
    Download
    AI Customize
    Chart guide slide with two green-tone line graphs displaying data points, captions on the right, and a text footer.
    Free
    Add to Wishlist
    Download
    AI Customize
    Pie chart illustration showcasing five data segments in varying colors with percentage labels and connected captions areas.
    Add to Wishlist
    Download
    AI Customize
    Vertical Microsoft infographic with four colored arrows each labeled with icons for business, target, analytics, and money.
    Add to Wishlist
    Download
    AI Customize
    KPI slide showcasing cash flow metrics and financial performance over six months in different bar chat layouts.
    Free
    Add to Wishlist
    Download
    AI Customize
    Comparison bar chart showing percentage values from 2011 to 2019 for chat and security categories.