Infographic PowerPoint Template for Data Presentation


Infographic PowerPoint Template and Google Slides
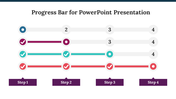
The "Infographic PowerPoint Template and Google Slides" features a 3D surface plot with a color scale, depicting a mountain range with peaks and valleys to represent data in a visually engaging manner. The color scale indicates the elevation of the terrain, providing a clear visualization of the information presented. With a clean white background, this template ensures clarity and focus on the data being presented.
This template is perfect for visualizing complex data sets, presenting research findings, illustrating geographical information, or showcasing statistical trends. It can be used in academic presentations, research reports, data analysis projects, and business presentations to convey information effectively. Suitable for researchers, academics, data analysts, scientists, educators, and professionals.
Compatible with PowerPoint and Google Slides. Available in "16:9" and "4:3" formats and zip files for easy sharing. Free and fully customizable, allowing users to modify colors, text, and graphics to suit their specific presentation needs. Download this template now to create visually stunning presentations that effectively communicate complex data and insights.


You May Also Like These PowerPoint Templates
Add to Wishlist
Download
Edit

Add to Wishlist
Download
Edit

Add to Wishlist
Download
Edit

Add to Wishlist
Download
Edit

Add to Wishlist
Download
Edit

Add to Wishlist
Download
Edit

Add to Wishlist
Download
Edit


Add to Wishlist
Download
Edit


Add to Wishlist
Download
Edit

Add to Wishlist
Download
Edit


Add to Wishlist
Download
Edit

Add to Wishlist
Download
Edit

Add to Wishlist
Download
Edit

Add to Wishlist
Download
Edit

Add to Wishlist
Download
Edit

Add to Wishlist
Download
Edit

