dashboard PPT

Slide showcasing key elements of the dashboard including icons representing geographical data and performance metrics.
P.ID : 8929
    233 views
    15 Downloads
    Get Custom Slides by Experts
    Instantly Access Templates in PowerPoint

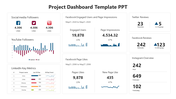
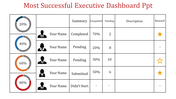
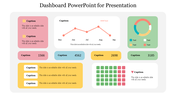
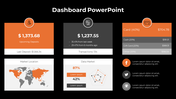
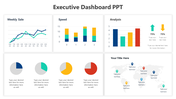
    Dashboard PowerPoint Template


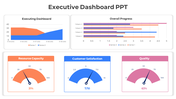
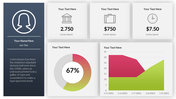
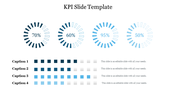
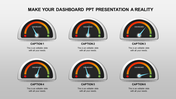
    Improve your presentations with our Dashboard PowerPoint template! This editable slide is a game-changer, featuring two dynamic captions - one with a word map and the other showcasing a sleek speedometer graphic. Tailor it effortlessly to match your content and impress your audience.

    Who benefits? Executives, educators, and creatives looking to convey information effectively. Why? Clear visuals boost understanding. How? Edit and captivate effortlessly. Ready to level up your presentations? Download our Dashboard PowerPoint template now for a seamless blend of style and substance! Your audience will thank you.

    Features of the Template


    • 100 % customizable slides.
    •  The slide show is in 4:3, 16:9, zip format.
    •  There is powerful connectivity with PowerPoint Templates.
    •  It is simple and quick to alter the slide's color.
    •  An efficient template that can be easily accessed immediately.
    •  Well-crafted template with an instant download facility.
    Advertisement

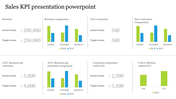
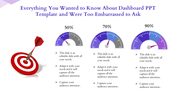
    You May Also Like These PowerPoint Templates

    Add to Wishlist
    Download
    AI Customize
    KPI dashboard with a mix of bar, pie, and line charts highlighting revenue, sales, and customer buying patterns.
    Add to Wishlist
    Download
    AI Customize
    Our Predesigned KPI Presentation Template Slide Design
    Add to Wishlist
    Download
    AI Customize
    Modern dashboard PowerPoint template featuring circular progress charts, bar graphs, and key performance metrics.
    Free
    Add to Wishlist
    Download
    AI Customize
    Bar chart comparing increases and decreases for movies like Avatar and Aquaman, with title logos below.
    Add to Wishlist
    Download
    AI Customize
    Dashboard PPT template with three colored gauges showing 30, 60, and 90 percent completion with captions.
    Add to Wishlist
    Download
    AI Customize
    KPI PowerPoint template with a gauge and table for displaying yearly financial data on a white backdrop.
    Add to Wishlist
    Download
    AI Customize
    Speedometer dashboard PowerPoint slides showing three colored gauges with 25, 50, and 75 percent progress with captions.
    Add to Wishlist
    Download
    AI Customize
    Dashboard PPT slide showcasing defect rates, supplier analysis, revenue breakdown, and delivery time analysis with charts.
    Add to Wishlist
    Download
    AI Customize
    KPI PowerPoint slide featuring three colored gauges for Revenue, Sales, and Sales Value with respective values.
    Add to Wishlist
    Download
    AI Customize
    KPI dashboard template with bar and line graphs showing private school growth for 2017, 2018, and 2019 with educational data.
    Free
    Add to Wishlist
    Download
    AI Customize
    Free KPI Presentation PPT Template and Google Slides
    Add to Wishlist
    Download
    AI Customize
    Executive Dashboard slide showing key performance metrics such as revenue vs. target, customer acquisition, and CAC vs. CLV.
    Free
    Add to Wishlist
    Download
    AI Customize
    Dashboard template with a circular speedometer gauge in the center, divided into five blue segments labeled 01 to 05.
    Free
    Add to Wishlist
    Download
    AI Customize
    Colorful project dashboard PPT slide showing a bar chart for four sections with a pie chart detailing percentages.
    Add to Wishlist
    Download
    AI Customize
    Slide with a revenue chart and metrics for daily, weekly, and yearly sales, along with three user graphs.