MILESTONE 🌟 5 Million+ creative minds trust SlideEgg! Grab 80% OFF

Chart Presentation Templates - Graph PowerPoint Slide

Radar chart template with red data points and captions for four segments, illustrating performance metrics.
P.ID : 15802
    201 views
    6 Downloads
    Get Custom Slides by Experts
    Enhance Your Presentations with Add-ins
    Google Slides Add-in
    Access templates directly in Google Slides
    Microsoft PowerPoint Add-in
    Access templates directly in PowerPoint
    GPT Add-on
    AI-powered presentation assistance

    Chart Presentation Slides


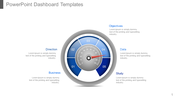
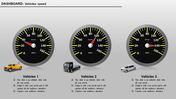
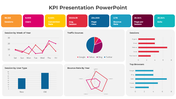
    Our Radar Chart PowerPoint Template is a game-changer for data visualization. With four nodes packed with captions, title holders, and text areas, this template is perfect for analysts, consultants, and strategists. Effortlessly communicate complex data, highlight trends, compare strategies, and showcase metrics with clarity. Say goodbye to static presentations and hello to dynamic storytelling. 

    Improve  your pitch, captivate your audience, and unlock new possibilities. Whether you're analyzing market trends or presenting business strategies, this template empowers you to leave a lasting impression. 

    Download our Radar Chart PowerPoint Template now and transform your presentations into engaging narratives that resonate. Stand out from the crowd and make your data come alive with this versatile and professional tool.

    Features of the Template

    • 100 % customizable slides.
    • The   slide show is in 4:3, 16:9, zip format.
    • There is powerful connectivity with Google Slides and PowerPoint.
    • It is simple and quick to alter the slide's color.
    • An efficient template that can be easily accessed immediately.
    • Well-crafted template with an instant download facility.
    Advertisement

    You May Also Like These PowerPoint Templates

    Add to Wishlist
    Download
    AI Customize
    Project schedule slide with a Gantt chart displaying tasks, timelines, and completion percentages.
    Free
    Add to Wishlist
    Download
    AI Customize
    Dashboard with line graphs, a circular chart with three segments, and labeled financial metrics, in red, orange, and green.
    Add to Wishlist
    Download
    AI Customize
    Dashboard slide showing Zantedeschia, Celosia, and Calendula growth data with a bar chart from 2012 to 2017.
    Free
    Add to Wishlist
    Download
    AI Customize
    Comparison of revenue and cost distributions with pie charts displaying CAPEX and OPEX percentages.
    Free
    Add to Wishlist
    Download
    AI Customize
    Horizontal Gantt chart showing tasks by days with segments in blue, purple, and black, indicating task progress and status.
    Add to Wishlist
    Download
    AI Customize
    Funnel infographic with blue, red, yellow, and green sections, each with icons, connected to text descriptions.
    Free
    Add to Wishlist
    Download
    AI Customize
    Four vertical orange columns and percentages, labeled by year, along with a businesswoman illustration on the right.
    Free
    Add to Wishlist
    Download
    AI Customize
    Chart with colorful bars representing yearly data from 2013 to 2020, paired with eight colorful cube icons on the sides.
    Add to Wishlist
    Download
    AI Customize
    Infographic chart with a truck carrying five colorful blocks and percentage bars, using green, orange, and brown tones.
    Free
    Add to Wishlist
    Download
    AI Customize
    A circular 3D chart in blue, green, purple, and orange representing yearly expansion categories and values.
    Free
    Add to Wishlist
    Download
    AI Customize
    Bar chart PowerPoint slides showcasing different business categories with colorful bars in different layout designs.
    Add to Wishlist
    Download
    AI Customize
    Chart infographic comparing data with orange and blue bars, alongside expense and budget details on the right.
    Add to Wishlist
    Download
    AI Customize
    Horizontal layout featuring five purple icons connected by a bar, with detailed text columns below each step.
    Free
    Add to Wishlist
    Download
    AI Customize
    A professional comparison slide featuring horizontal bar graphs displaying various percentages alongside captions with icons.
    Add to Wishlist
    Download
    AI Customize
    Company Annual Report slide featuring sections for overview, financial review, team management, and service offerings.
    Free
    Add to Wishlist
    Download
    AI Customize
    Annual report slide displaying a bar chart with color-coded percentages from 30% to 80% and caption areas.
    Free
    Add to Wishlist
    Download
    AI Customize
    Multi-color pie chart slide deck showing data segments in various shades, each section labelled for visual comparison.
    Add to Wishlist
    Download
    AI Customize
    Brand perception map illustrating consumer views on six brand tastes and natural qualities, with color coded labels.