MILESTONE 🌟 5 Million+ creative minds trust SlideEgg! Grab 80% OFF

Creative Line Chart PowerPoint Template and Google Slides

Slide with a three series line chart in green, pink, and blue, paired with a left aligned text section.
P.ID : 35250
    138 views
    7 Downloads
    Get Custom Slides by Experts
    Instantly Access Templates in PowerPoint

    Line Chart PowerPoint Template and Google Slides


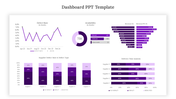
    Enhance your presentations with our versatile Chart Template, compatible with both PowerPoint and Google Slides. This template features a dynamic line chart design, incorporating three distinct colored lines, each marked with dots to highlight key data points.

    The clean and professional layout ensures clarity and impact, making it easy for your audience to grasp trends and insights at a glance. Whether you're showcasing financial data, project milestones, or market trends, our template provides ample space for annotations and explanations alongside the chart.

    Utilize this customizable template to create compelling presentations that effectively communicate complex information. Download now and impress your audience with visually engaging charts and graphs.

    Features of the template


    • 100% customizable slides and easy to download.
    • Slides are available in different nodes & colors.
    • The slide contains 16:9 and 4:3 formats.
    • It is easy to change the colors of the slide quickly. 
    • Well-crafted template with an instant download facility.
    Advertisement

    You May Also Like These PowerPoint Templates

    Add to Wishlist
    Download
    AI Customize
    Company annual report slide with a gray and red graph displaying data with percentage values for investment and profit.
    Free
    Add to Wishlist
    Download
    AI Customize
    Dashboard template with a circular speedometer gauge in the center, divided into five blue segments labeled 01 to 05.
    Add to Wishlist
    Download
    AI Customize
    Stacked bar chart with four vertical bars showing percentages from 2013, 2014, and 2015 in varying green shades.
    Add to Wishlist
    Download
    AI Customize
    Project timeline Gantt chart with color coded bars indicating task descriptions, assigned resources, and milestone markers.
    Add to Wishlist
    Download
    AI Customize
    PPT slide displaying various charts including bar charts, pie charts, calendars, and Gantt charts for project tracking.
    Free
    Add to Wishlist
    Download
    AI Customize
    KPI dashboard bar chart slide representing the height of the world's tallest hills with a world map marking their locations.
    Free
    Add to Wishlist
    Download
    AI Customize
    Dashboard infographic with three gauge meters in blue, green, and yellow, each labeled with a number and caption.
    Add to Wishlist
    Download
    AI Customize
    KPI dashboard slide with line chart, showing performance for four categories, along with circular percentage indicators.
    Add to Wishlist
    Download
    AI Customize
    PPT chart with five colorful percentage indicators displayed in curved circular segments, ranging from 30 to 70 percent.
    Add to Wishlist
    Download
    AI Customize
    Speedometer KPI dashboard showing speed readings for three vehicles a truck, a van, and a car.
    Free
    Add to Wishlist
    Download
    AI Customize
    Visual layout of various charts, including area and bar graphs, arranged in a grid format with caption areas.
    Add to Wishlist
    Download
    AI Customize
    KPI dashboard PowerPoint slide showing a bar chart with active accounts for different categories and percentage indicators.
    Add to Wishlist
    Download
    AI Customize
    Template showcasing various chart designs, including line, bar, pie, and comparison charts across multiple slides.
    Add to Wishlist
    Download
    AI Customize
    Six panel infographic featuring KPI metrics with colorful charts, graphs, and numerical data insights.
    Add to Wishlist
    Download
    AI Customize
    Creative charts showing a circular 60% approval metric, bar graphs, and a 55% Twitter engagement donut chart.
    Free
    Add to Wishlist
    Download
    AI Customize
    Gantt chart plan template showing tasks across months with a colorful circular pie chart and matching bars on theright.
    Add to Wishlist
    Download
    AI Customize
    Financial highlights slide with bar chart and circular gauges tracking sales, operating income, and expenses.
    Add to Wishlist
    Download
    AI Customize
    Project schedule slide with a Gantt chart displaying tasks, timelines, and completion percentages.
    Free
    Add to Wishlist
    Download
    AI Customize
    Dashboard with line graphs, a circular chart with three segments, and labeled financial metrics, in red, orange, and green.
    Add to Wishlist
    Download
    AI Customize
    Dashboard slide showing Zantedeschia, Celosia, and Calendula growth data with a bar chart from 2012 to 2017.