Our Predesigned Business Analytics PowerPoint Presentation

Business analytics template with three icons and text sections, over a background image of documents and charts.
P.ID : 33969
    295 views
    6 Downloads
    Get Custom Slides by Experts
    Instantly Access Templates in PowerPoint

    "Unlock Your Data Potential: Business Analytics PowerPoint Template"


    Imagine effortlessly transforming intricate data into captivating presentations that resonate with clarity and impact. Our Business Analytics PowerPoint Template and Google Slides Themes are designed to do just that. 

    Tailored for analysts, strategists, and entrepreneurs alike, this template features dedicated nodes for accounting, marketing, and entrepreneurship. Each node includes caption, title, and text areas, ensuring seamless customization for your specific needs. 

    Whether you're deciphering financial trends, unveiling market strategies, or pitching entrepreneurial visions, this tool empowers you to craft compelling narratives with ease. Efficient, versatile, and meticulously crafted, it enables you to communicate complex data dynamically while saving precious time. 

    Improve your storytelling prowess and captivate your audience from start to finish with our powerful template, setting new standards in business presentation excellence.

    Features of the Template


    • 100 % customisable slides.
    • The slide show is in 4:3, 16:9, zip format.
    • There is powerful connectivity with Google Slides and PowerPoint.
    • It is simple and quick to alter the slide's colour.
    • An efficient template that can be easily accessed immediately.
    • Well-crafted template with an instant download facility.  
    Advertisement

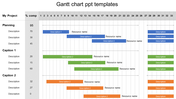
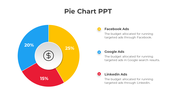
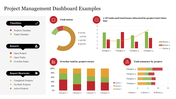
    You May Also Like These PowerPoint Templates

    Add to Wishlist
    Download
    AI Customize
    Stacked bar chart template with green gradients, showing data from 2017 to 2020, with labeled sections.
    Add to Wishlist
    Download
    AI Customize
    Visual KPI layout with performance bar chart, doughnut chart, and percentage indicators for project analysis.
    Add to Wishlist
    Download
    AI Customize
    Dashboard PowerPoint Template and Google Slides
    Add to Wishlist
    Download
    AI Customize
    Row of four colored speedometer-style gauges, each showing varying percentages with needle, and captions at the bottom.
    Add to Wishlist
    Download
    AI Customize
    Three pie charts in brown, blue, and green sections, each with labeled percentages and caption lines.
    Free
    Add to Wishlist
    Download
    AI Customize
    Multicolored circular pie chart in yellow, red, and green, with labeled categories listed on the right.
    Add to Wishlist
    Download
    AI Customize
    Four donut charts in red, blue, green, and yellow, displaying percentages with corresponding content boxes below.
    Free
    Add to Wishlist
    Download
    AI Customize
    KPI dashboard with a data table on the left and a circular chart on the right, featuring shades of teal and white.
    Add to Wishlist
    Download
    AI Customize
    A chart with three vertical bars in red, purple, and orange, with icons and descriptive text on the left.
    Free
    Add to Wishlist
    Download
    AI Customize
    Bar chart with five vertical bars representing data analysis with various high, low, and volume indicators displayed.
    Add to Wishlist
    Download
    AI Customize
    A monthly PowerPoint template displaying colorful wave like graphs for each month from January to June with placeholder text.
    Add to Wishlist
    Download
    AI Customize
    KPI themed slide with data visualization including pie charts, bar graphs, line graphs, and key metrics.
    Free
    Add to Wishlist
    Download
    AI Customize
    Colorful bar chart with three data categories and corresponding bars each with caption areas.
    Add to Wishlist
    Download
    AI Customize
    Six semicircular gauges with colored indicators in red, purple, blue, yellow, pink, and green on a white backdrop.
    Free
    Add to Wishlist
    Download
    AI Customize
    Slide showcasing three different types of colored charts an area chart, a bar chart, and a line chart, with captions below.
    Add to Wishlist
    Download
    AI Customize
    Three pie charts with segmented sections and percentage labels, each chart featuring placeholder text below.
    Add to Wishlist
    Download
    AI Customize
    A pie chart template with three circular charts representing each with text and icons beside them.