Best PowerPoint Chart Template And Google Slides

Creative PPT Chart Template Presentation
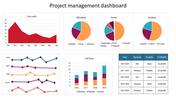
You have spent hours fiddling with spreadsheets and now you have an important presentation coming up. But how does one make sense of complicated information that will actually entice the audience? Meet your new best friend – this creative PowerPoint chart template that will help you turn data into a genuine story.
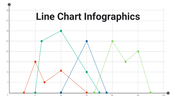
Image: This template has a graphical representation in the form of a line graph that pits data against three consecutive years (2017, 2018, 2019) making it suitable for illustrating growth or decline.
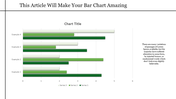
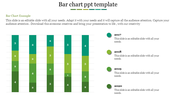
Color: No longer will people settle for run-of-the-mill shades of blue or green. This template is very colorful and flashy for that added professional look that can easily be edited. Looking for a brand match? Oh no worries – just a couple of clicks and it is ready.
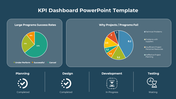
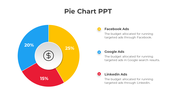
Design: This template is not only easy but also visually appealing when it comes to completion. Well, all you need to do is input your data into the template, and the chart will be filled immediately. Two collapsible text fields are added to insert descriptions or, in some cases, labels to enhance the readability of your information.
Don’t waste time trying to find the right way to do data visualization. Get this PowerPoint chart template and elevate your presentations into engaging data storytelling pieces NOW!
Features of the template
- 100% customizable slides and easy to download.
- The slides contain 16:9 and 4:3 formats.
- Easy to change the colors quickly.
- It is a well-crafted template with an instant download facility.
- It is a 100% pre-designed slide.
- The slide holds vibrant colors.


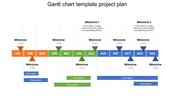
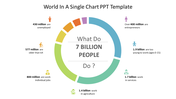
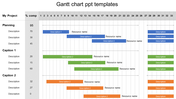
You May Also Like These PowerPoint Templates
Add to Wishlist
Download
Edit

Add to Wishlist
Download
Edit

Add to Wishlist
Download
Edit


Add to Wishlist
Download
Edit

Add to Wishlist
Download
Edit


Add to Wishlist
Download
Edit


Add to Wishlist
Download
Edit

Add to Wishlist
Download
Edit


Add to Wishlist
Download
Edit

Add to Wishlist
Download
Edit


Add to Wishlist
Download
Edit

Add to Wishlist
Download
Edit

Add to Wishlist
Download
Edit

Add to Wishlist
Download
Edit

Add to Wishlist
Download
Edit
