MILESTONE 5 Million+ creative minds trust SlideEgg! Grab 80% OFF

Data Visualization Presentation And Canva Templates

Pack of 15 slides
P.ID : 76238
Advertisement
1 views
1 Downloads
Get Custom Slides by Experts
Enhance Your Presentations with Add-ins
Google Slides Add-in
Access templates directly in Google Slides
Microsoft PowerPoint Add-in
Access templates directly in PowerPoint
GPT Add-on
AI-powered presentation assistance

Data Visualization PowerPoint, Google Slides, and Canva Template


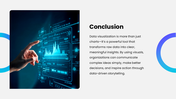
Present your data with confidence and clarity using this Data Visualization Presentation Template, thoughtfully designed to make your information stand out. Whether you’re explaining analytics, showcasing trends, or visualizing research results, this template helps you communicate complex data in a simple, visual, and professional way.

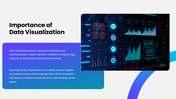
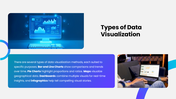
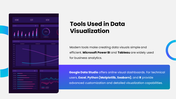
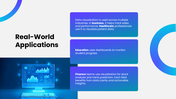
With clean layouts, engaging infographics, and dynamic visuals, you can present topics like types of data visualization, tools used, importance, and real-world applications with ease. Each slide is carefully structured to guide your audience through key insights while keeping the presentation visually balanced and impactful.

Perfect for business professionals, data analysts, educators, and students, this template ensures your message is understood at a glance. 


Everything is set up for you. Simply add your content, adjust the visuals to your theme, and you’re ready to deliver a polished, professional data story that truly connects with your audience.


Features of this template

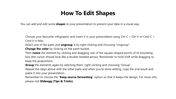
  • 100% customizable slides and easy to download.
  • The slides contain 16:9 and 4:3 formats.
  • Easy to change the colors quickly.
  • Highly compatible with PowerPoint, Google Slides, and Canva templates.

You May Also Like These PowerPoint Templates

Add to Wishlist
Download
AI Customize
Five colored diamond shapes representing data cleansing strategies, such as automated validation and error detection.
Free
Add to Wishlist
Download
AI Customize
Data science responsibilities infographic with five U shaped blocks numbered from data collection to data storytelling.
Free
Add to Wishlist
Download
AI Customize
Data analysis slide with a business figure illustration and bar chart, featuring four colorful captions on a dark backdrop.
Add to Wishlist
Download
AI Customize
Illustration of a person interacting with blue data visualization panels, with three numbered text sections on the right.
Add to Wishlist
Download
AI Customize
Pack of slide showcasing data collection methods with icons in different colors on a white backdrop.
Add to Wishlist
Download
AI Customize
Colorful data analysis PowerPoint slide with three groups of progress bars showing percentages for each section.
Add to Wishlist
Download
AI Customize
Illustration of a man holding a laptop with data visualization, alongside three numbered text sections with green arrows.
Add to Wishlist
Download
AI Customize
Data science benefits visualized in a four step process with numbered colorful tabs in pink, green, orange, and blue.
Add to Wishlist
Download
AI Customize
Three colored rectangles in orange, green, and teal, representing types of data stewards with text areas below.
Add to Wishlist
Download
AI Customize
Applications of Data Science in retail marketing, including recommendation systems to inventory management with text.
Add to Wishlist
Download
AI Customize
Informative slides about data science, highlighting colorful different layout designs and icons.
Add to Wishlist
Download
AI Customize
Data analytics slide showing month wise vertical bars in varied colors, with July emphasized as top performing.
Add to Wishlist
Download
AI Customize
Data analysis slide with a monitor showing analytics icons, and five colorful speech bubbles indicating various steps around it.
Add to Wishlist
Download
AI Customize
Add to Wishlist
Download
AI Customize
Business data analysis graphic with target and arrows in center, surrounded by six colored captions with icons on both sides.
Add to Wishlist
Download
AI Customize
Big data analytics slide deck with colorful charts, showcasing types, benefits, and decision making aids.
Add to Wishlist
Download
AI Customize
Data analysis template with a bar graph and illustrated dashboard layout with two caption areas for data.