MILESTONE 🌟 5 Million+ creative minds trust SlideEgg! Grab 80% OFF

Dashboard PowerPoint Slides For Presentation

Plant growth dashboard with descriptive text, a bar chart comparing three plants, and individual species information cards.
P.ID : 34855
    233 views
    10 Downloads
    Get Custom Slides by Experts
    Instantly Access Templates in PowerPoint

    Visualize Data Effortlessly with the Dashboard PowerPoint Template


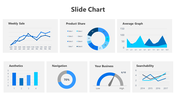
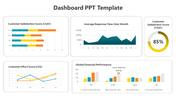
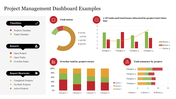
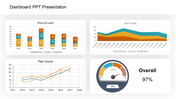
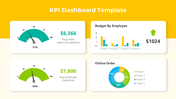
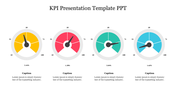
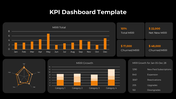
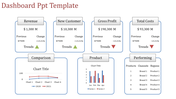
    Dashboards are essential for monitoring performance and making data-driven decisions. The "Dashboard PowerPoint Template and Google Slides Themes" is designed to help you present complex data in a clear and organized manner. This template features a description text area for detailed explanations, a graph to visualize key metrics, and three distinct sections, each with different icons representing various data points.

    Perfect for business reviews, performance tracking, and project management, this template enables you to present data in an engaging and easily digestible format. Its professional design and intuitive layout make it easy to highlight important trends and insights, ensuring your audience stays informed and engaged. Use this template to create impactful dashboards that drive better decision-making.

    Features of this template:


    • 100 % customizable slides are easy to download. 
    • Slides are available in different nodes and colors.
    • The slide was contained in 16:9 and 4:3 formats.
    • It is easy to change the slide colors quickly.
    • Well-crafted template with an instant download facility.
    • The clear layout of this template will help you design a professional-looking presentation.
    • The multi-color visuals on this slide will make your presentation eye-catching.
    Advertisement

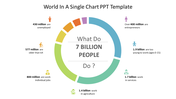
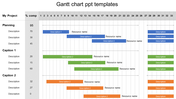
    You May Also Like These PowerPoint Templates

    Add to Wishlist
    Download
    AI Customize
    Customer Service PowerPoint Slide for Effective Service
    Add to Wishlist
    Download
    AI Customize
    Four donut charts in red, blue, green, and yellow, displaying percentages with corresponding content boxes below.
    Add to Wishlist
    Download
    AI Customize
    Speedometer graphic with six sections from green to red color gradient, each with icons and text areas.
    Add to Wishlist
    Download
    AI Customize
    Semi circular meter template with green, lime, yellow, and red sections, each displaying thumbs up icons, and text.
    Free
    Add to Wishlist
    Download
    AI Customize
    KPI dashboard with a data table on the left and a circular chart on the right, featuring shades of teal and white.
    Add to Wishlist
    Download
    AI Customize
    A chart with three vertical bars in red, purple, and orange, with icons and descriptive text on the left.
    Free
    Add to Wishlist
    Download
    AI Customize
    Bar chart with five vertical bars representing data analysis with various high, low, and volume indicators displayed.
    Add to Wishlist
    Download
    AI Customize
    A monthly PowerPoint template displaying colorful wave like graphs for each month from January to June with placeholder text.
    Free
    Add to Wishlist
    Download
    AI Customize
    Effective Speedometer PowerPoint Template Presentation
    Add to Wishlist
    Download
    AI Customize
    KPI themed slide with data visualization including pie charts, bar graphs, line graphs, and key metrics.
    Free
    Add to Wishlist
    Download
    AI Customize
    Colorful bar chart with three data categories and corresponding bars each with caption areas.
    Add to Wishlist
    Download
    AI Customize
    Executive dashboard with a portfolio summary table listing project details and a pie chart displaying a quarterly report.
    Add to Wishlist
    Download
    AI Customize
    Six semicircular gauges with colored indicators in red, purple, blue, yellow, pink, and green on a white backdrop.
    Add to Wishlist
    Download
    AI Customize
    Dashboard template showing main categories, team metrics, and performance details with various visual elements.
    Free
    Add to Wishlist
    Download
    AI Customize
    Slide showcasing three different types of colored charts an area chart, a bar chart, and a line chart, with captions below.
    Add to Wishlist
    Download
    AI Customize
    Three pie charts with segmented sections and percentage labels, each chart featuring placeholder text below.
    Add to Wishlist
    Download
    AI Customize
    Tachometer slide featuring a dial with a needle pointing to colored segments and four caption areas.