Chart PowerPoint Presentation Template
Elevate your data presentations with the "Chart PowerPoint Presentation Template." Perfect for professionals, analysts, educators, and diverse industries, this package revolutionizes how you communicate numerical insights.
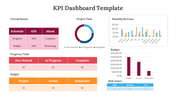
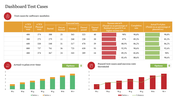
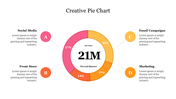
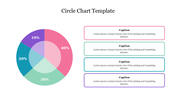
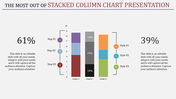
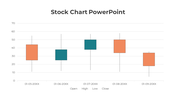
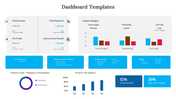
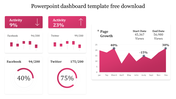
The donut chart template brings vibrancy to proportions, utilizing green, yellow, red, and blue. For stacked 100% column charts, leverage three levels of detailed, color-coded data representation.
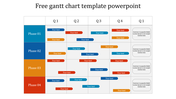
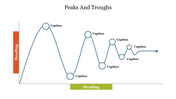
The waterfall chart visually depicts cumulative effects, making sequential impacts crystal clear. Suited for business reports, academic presentations, and project updates, these templates cater to a broad audience.
Accessible in "16:9," "4:3," and zip formats, this free, 100% customizable template ensures flexibility in various settings. Download now and transform raw data into compelling visual narratives, captivating colleagues, clients, and stakeholders.
Let your data tell a compelling story effortlessly – revolutionize your presentations with our Chart PowerPoint Template!