Chart PowerPoint Presentation Template and Google Slides

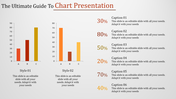
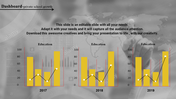
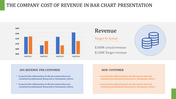
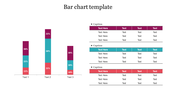
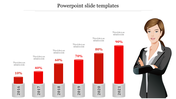
Chart Presentation Template
Do you find it hard to present complex data in a way that captures your audience's attention? Our "Chart Presentation Template" can help you succeed. This template features a clear, high-resolution image of a busy construction site that grabs your audience’s eyes right away. Over this image is a bold bar chart showing year-over-year progress. There are four captions you can edit to highlight important milestones, achievements, and project details.
Whether you're a student presenting research, a business professional sharing financial reports, or a manager showing key performance indicators, this template offers a professional and engaging way to present your data. You can easily customize the chart data, captions, and color scheme to fit your needs. This versatile template makes it simple to communicate complex information. Download the Template today and make your presentations more impactful!
Features of the template
- Slides are available in different nodes & colors.
- Easy to change the slide colors.
- Well-crafted template with instant download.
- Highly compatible with PowerPoint and Google Slides.


You May Also Like These PowerPoint Templates
Add to Wishlist
Download
Edit

Add to Wishlist
Download
Edit


Add to Wishlist
Download
Edit

Add to Wishlist
Download
Edit

Add to Wishlist
Download
Edit


Add to Wishlist
Download
Edit

Add to Wishlist
Download
Edit

Add to Wishlist
Download
Edit

Add to Wishlist
Download
Edit


Add to Wishlist
Download
Edit

Add to Wishlist
Download
Edit


Add to Wishlist
Download
Edit

Add to Wishlist
Download
Edit


