MILESTONE 🌟 5 Million+ creative minds trust SlideEgg! Grab 80% OFF

Chart PPT Presentation Template for Insightful Data Analysis

Area chart showing blue, green, and red sections from 2016 to 2020 with three labeled placeholders below.
P.ID : 25989
    116 views
    2 Downloads
    Get Custom Slides by Experts
    Instantly Access Templates in PowerPoint

    Editable Chart Presentation Template


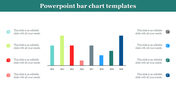
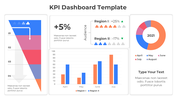
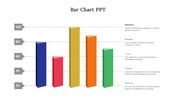
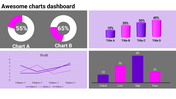
    Explore the realm of impactful presentations with our Chart Presentation template. This dynamic slide features a vibrant bar chart image set against a clean white background, offering a visually striking canvas for your data.

    Who can use these slides? Professionals across industries, educators, analysts, and marketers alike can leverage our template to convey complex information with clarity and precision.

    How can our template transform your presentations? It simplifies the process of data visualization, enabling you to create engaging charts that resonate with your audience. Download our Chart Presentation template now and unlock the full potential of your data!

    Feature of the template

    • 100% customizable slides and easy to download.
    • Slides are available in different nodes & colors.
    • The slide is contained in 16:9 and 4:3 format.
    • Easy to change the slide colors quickly.
    • Well-crafted template with an instant download facility. 
    Advertisement

    You May Also Like These PowerPoint Templates

    Add to Wishlist
    Download
    AI Customize
    Slide deck with KPI charts and graphs for business analysis, including financials, HR performance, and customer service.
    Add to Wishlist
    Download
    AI Customize
    KPI dashboard template with a line chart, progress indicators, and bar graphs showing different performance metrics.
    Free
    Add to Wishlist
    Download
    AI Customize
    Project dashboard slide for electricity data with bar graphs showing units and amounts for different categories and months.
    Add to Wishlist
    Download
    AI Customize
    Chart infographic comparing data with orange and blue bars, alongside expense and budget details on the right.
    Add to Wishlist
    Download
    AI Customize
    Horizontal layout featuring five purple icons connected by a bar, with detailed text columns below each step.
    Add to Wishlist
    Download
    AI Customize
    KPI dashboard template with progress bars, pie chart, bar graphs, and workload metrics in a clean blue theme.
    Add to Wishlist
    Download
    AI Customize
    Dashboard slide showing business performance, including technology, accessibility, and security scores with activity graphs.
    Free
    Add to Wishlist
    Download
    AI Customize
    A professional comparison slide featuring horizontal bar graphs displaying various percentages alongside captions with icons.
    Free
    Add to Wishlist
    Download
    AI Customize
    Dashboard with four sections showing charts, icons, and metrics in purple, red, green, and teal.
    Free
    Add to Wishlist
    Download
    AI Customize
    KPI dashboard with percentage stats, bar charts, and flow diagrams in red, blue, and orange representing data trends.
    Add to Wishlist
    Download
    AI Customize
    KPI dashboard slide displaying supplier metrics with colorful pie charts, bar graphs, and a process flow with percentages.
    Add to Wishlist
    Download
    AI Customize
    Company Annual Report slide featuring sections for overview, financial review, team management, and service offerings.
    Free
    Add to Wishlist
    Download
    AI Customize
    Project plan Gantt chart template with timeline, color coded tasks descriptions, and milestones spanning from 2017 to 2019.
    Free
    Add to Wishlist
    Download
    AI Customize
     KPI dashboard featuring colorful graphs, sales metrics, real estate charts, and visitor statistics, in a grid layout.
    Free
    Add to Wishlist
    Download
    AI Customize
    Annual report slide displaying a bar chart with color-coded percentages from 30% to 80% and caption areas.
    Free
    Add to Wishlist
    Download
    AI Customize
    A detailed Gantt chart slide illustrating project timelines with tasks spanning different durations for 2021 and 2022.
    Free
    Add to Wishlist
    Download
    AI Customize
    Slide with multiple dashboard elements including bar charts, line charts, pie charts, and progress meters in various colors.