Informative Quality Framework PowerPoint And Google Slides

 Canva
Canva
Quality Framework PPT, Google Slides, And Canva Template
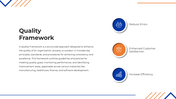
A quality framework refers to a structured system that ensures that services or products meet defined standards. This presentation slide deck highlights essential quality principles such as continuous improvement, customer focus, and measurable performance indicators. Designed to clearly communicate quality assurance, it provides a professional tool for your presentations and reporting needs.
Purpose Of The Slides
The main purpose of this slide is to help professionals visualize quality management concepts. It can be used to introduce frameworks, demonstrate improvement strategies, or explain audit results. The design includes icons, color blocks, and editable text zones to ensure that the message is professional, easy to follow, and visually appealing.
Who Can Use It?
Perfect for quality managers, project leaders, students, business analysts, and consultants. Whether you’re training, presenting reports, or presenting a new quality strategy, this slide provides a smart layout to support your content. Educators and learners can also use it for classroom instruction or educational case studies.
Special Key Features
Fully editable and customizable layout. Includes data visualizations, section dividers, and quality management icons. Compatible with PowerPoint, Canva, and Google Slides. Download now to confidently present your quality framework and increase engagement in your next meeting or training session with clarity and impact.
Features of this template
- 100% customizable slides and easy to download.
- The slides contain 16:9 and 4:3 formats.
- Easy to change the colors quickly.
- Highly compatible with PowerPoint, Google Slides, and Canva templates.


You May Also Like These PowerPoint Templates
Add to Wishlist
Download
Edit

Add to Wishlist
Download
Edit

Add to Wishlist
Download
Edit


Add to Wishlist
Download
Edit

Add to Wishlist
Download
Edit

Add to Wishlist
Download
Edit

Add to Wishlist
Download
Edit

Add to Wishlist
Download
Edit


Add to Wishlist
Download
Edit

Add to Wishlist
Download
Edit

Add to Wishlist
Download
Edit

Add to Wishlist
Download
Edit

Add to Wishlist
Download
Edit

Add to Wishlist
Download
Edit

Add to Wishlist
Download
Edit

Add to Wishlist
Download
Edit

Add to Wishlist
Download
Edit

Add to Wishlist
Download
Edit

Add to Wishlist
Download
Edit

Add to Wishlist
Download

Add to Wishlist
Download
Edit

Add to Wishlist
Download
Edit

Add to Wishlist
Download

Add to Wishlist
Download
Edit

Add to Wishlist
Download
Edit

Add to Wishlist
Download
Edit


Add to Wishlist
Download
Edit


Add to Wishlist
Download
Edit

Add to Wishlist
Download
Edit

Add to Wishlist
Download
Edit

Showing36 of69,218 templates