MILESTONE 🌟 5 Million+ creative minds trust SlideEgg! Grab 80% OFF

The Best PowerPoint Chart Templates Presentation

Bar chart showing company growth from 2014 to 2019, with increasing blue bars representing annual progress on the y-axis.
P.ID : 31988
    212 views
    2 Downloads
    Get Custom Slides by Experts
    Instantly Access Templates in PowerPoint

    Visualize Success With PowerPoint Chart Templates


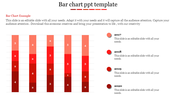
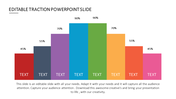
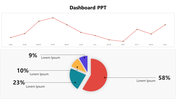
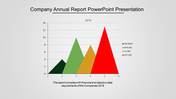
    The PowerPoint chart templates come with an extended bar chart regarding company growth from 2014 to 2019. This is a great template that offers clear annual progress with a visual impact.

    Slide Description:

    Off it goes with a bar chart, which visibly showcases company growth over six years to make it easier to put across data-driven insights. It has yearly progress represented by data from 2014-2019, hence serving with an elaborate overview of the growth trends.

    Who Can Benefit from this template?

    This template will be very useful for business professionals, analysts, and educators in presenting financial data, performance metrics, and growth analysis. In its simplest format, your audience will help the audience decipher major trends at a glance from the bar chart.

    Bring life to your presentations with our PowerPoint chart template.

    Features of the template


    • 100% customizable slides and easy to download.
    • The slides contain 16:9 and 4:3 formats.
    • Easy to change the colors quickly.
    • It is a well-crafted template with an instant download facility.
    • It is a 100% pre-designed slide.
    • The slide holds vibrant colors.
    Advertisement

    You May Also Like These PowerPoint Templates

    Free
    Add to Wishlist
    Download
    AI Customize
    PowerPoint slide showcasing projected cash flows, NPV for 3 and 5 years, and payback period with client testimonial.
    Add to Wishlist
    Download
    AI Customize
    Six month Gantt chart with bars in blue, green, red, orange, and teal, arranged for task tracking.
    Free
    Add to Wishlist
    Download
    AI Customize
    Infographic of a bar chart representing yearly growth from 2018 to 2021 with a businesswoman illustration.
    Add to Wishlist
    Download
    AI Customize
    Circular pie chart divided into five colored sections noted with percentages, with corresponding boxes for text area.
    Add to Wishlist
    Download
    AI Customize
    Three panel dashboard with column, bar, and funnel charts at the top and numbered blue boxes with text below.
    Free
    Add to Wishlist
    Download
    AI Customize
    3D bar chart PowerPoint template showcasing data in four colored categories with a highlight and captions.
    Free
    Add to Wishlist
    Download
    AI Customize
    KPI dashboard layout with blue semicircle gauges and line charts representing social media performance metrics.
    Free
    Add to Wishlist
    Download
    AI Customize
    Horizontal chart with dual color bars in green and blue, displaying percentage values, and two captions on the right.
    Add to Wishlist
    Download
    AI Customize
    Slide with a vertical bar chart and four labeled sections, each paired with a unique color and icon.
    Add to Wishlist
    Download
    AI Customize
    Dashboard-themed slide with semi-circle charts for business analysis, featuring metrics and reflective silhouettes at the bottom.
    Add to Wishlist
    Download
    AI Customize
    Bar chart infographic with four blue bars for kpi forecasts, a line graph overlay, and a man with a magnifying glass.
    Add to Wishlist
    Download
    AI Customize
    Executive dashboard slide featuring bar graphs and pie charts comparing project data over three years, with text boxes.
    Add to Wishlist
    Download
    AI Customize
    Semi circular gauge in shades of brown and peach with a pointer, alongside text and a silhouette group at the bottom.
    Free
    Add to Wishlist
    Download
    AI Customize
    An executive dashboard showing income and expense distribution, with key financial metrics and a line graph.
    Free
    Add to Wishlist
    Download
    AI Customize
    Market research slide showing a line graph with three levels over the years 2016 and 2019, with a caption box.
    Add to Wishlist
    Download
    AI Customize
    Slide with blue stats on the left and various charts, including bar and pie charts in different colors.