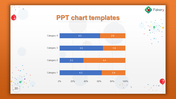
Ready To Use PowerPoint Chart Templates and Google Slides

 Canva
Canva
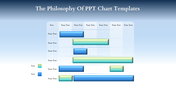
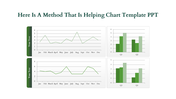
PowerPoint Chart Template and Google Slides Themes
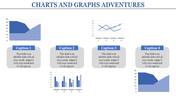
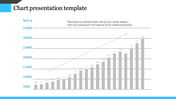
Our PowerPoint Chart Template and Google Slides offer a flexible solution for crafting a thorough chart presentation that requires a design to be both visually appealing and informative. Featuring 14 red dots with captions on a clean white background, our template presents complex data in a clear and organized layout. Each dot and caption combo provides a concise representation of key data points, ensuring clarity and easy understanding for your audience.
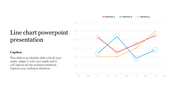
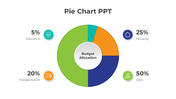
With our editable template, you can customize the chart to fit your specific dataset and presentation requirements. Whether you're analyzing trends, displaying market research, or presenting financial data, our template lets you convey your message effectively.
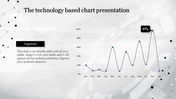
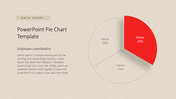
Designed for analysts, researchers, educators, and business professionals, this template is a valuable tool for visualizing data-driven insights and making informed decisions. Elevate your chart presentations with our template and engage your audience with compelling visuals and valuable information.
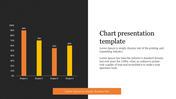
Features of the template
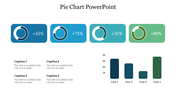
- 100% customizable slides and easy to download.
- Slides are available in different nodes & colors.
- The slide contains 16:9 and 4:3 formats.
- It is easy to change the colors of the slide quickly.
- Well-crafted template with an instant download facility.


You May Also Like These PowerPoint Templates


