Executive Dashboard Google Slides And PPT Template

Four directional cross shaped layout, showing plans 1 to 4 connected to a central square, each with text.
P.ID : 3882
    242 views
    8 Downloads
    Get Custom Slides by Experts
    Instantly Access Templates in PowerPoint

    Executive Dashboard PowerPoint, Google Slides, and Canva Template


    An executive dashboard is a powerful tool for visualizing critical business data, providing professionals with actionable insights at a glance. This template is designed to help you track key performance indicators (KPIs), analyze trends, and align strategies effectively.

    Purpose Of The Slides

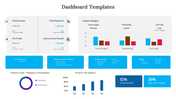
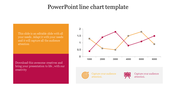
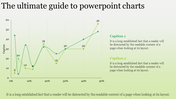
    This single-slide executive dashboard template focuses on simplifying complex data. It features two clean line graphs for tracking performance metrics and three insights blocks to display key values. The user-friendly design and modern blue theme ensure data clarity, making it perfect for professional presentations.

    Who Can Use It?

    This template is ideal for:

    • Executives and managers: Showcase business performance, track KPIs, and drive strategic decisions.
    • Data analysts: visualize financial trends, monthly targets, or project insights.
    • Students and educators: Create engaging presentations for data analysis projects.
    • Consultants: Deliver clear, data-backed solutions to clients.

    Special Key Features

    Easy to customize, visually appealing, and tailored for impactful presentations, this slide helps you present complex data with clarity and precision. Download the executive dashboard slide to simplify reporting, highlight performance metrics, and impress your audience with well-organized, professional visuals. Perfect for board meetings, business reviews, and strategic planning sessions.


    Features of this template

    • 100% customizable slides and easy to download.
    • The slides contain 16:9 and 4:3 formats.
    • Easy to change the colors quickly.
    • Highly compatible with PowerPoint, Google Slides, and Canva templates.
    Advertisement

    You May Also Like These PowerPoint Templates

    Add to Wishlist
    Download
    AI Customize
    Executive dashboard template showcasing growth, progress, and performance metrics for effective management.
    Add to Wishlist
    Download
    AI Customize
    KPI slide showcasing cash flow metrics and financial performance over six months in different bar chat layouts.
    Add to Wishlist
    Download
    AI Customize
    Dashboard slide with two green gauge meters, each labeled with a caption and text below.
    Add to Wishlist
    Download
    AI Customize
    Microsoft dashboard slide showcasing supply chain costs, inventory to sales ratio, and carrying cost of inventory.
    Add to Wishlist
    Download
    AI Customize
    Project status dashboard slide displaying budgets and performance metrics for banners, social media, and brochures.
    Add to Wishlist
    Download
    AI Customize
    PowerPoint slide with a tachometer graphic showing numbers 1 through 8 in different colors, with placeholders for captions.
    Add to Wishlist
    Download
    AI Customize
    Colorful tachometer PowerPoint slide design with transportation icons including airplane, car, bus, and train with captions.
    Add to Wishlist
    Download
    AI Customize
    Ten speedometer icons in two rows, each with blue, green, and red segments, ranging from 0 to 100.
    Add to Wishlist
    Download
    AI Customize
    Tachometer slide with four gauges in orange, red, blue, and green, each with captions below describing different readings.
    Add to Wishlist
    Download
    AI Customize
    Dashboard with bar charts, line graphs, and a gauge chart in various colors and a percentage indicator, on white background.
    Add to Wishlist
    Download
    AI Customize
    Slide displaying a profit and loss presentation with a colorful gauge in the center, indicating profit and loss levels.
    Add to Wishlist
    Download
    AI Customize
    KPI dashboard layout with a yellow header, two gauge in teal and green, bar metrics, and pie charts on a light background.
    Add to Wishlist
    Download
    AI Customize
    Seven rectangular sections with financial data on top and visual charts below, bordered in blue with organized text.
    Add to Wishlist
    Download
    AI Customize
    Customer Service PowerPoint Slide for Effective Service
    Add to Wishlist
    Download
    AI Customize
    Speedometer graphic with six sections from green to red color gradient, each with icons and text areas.
    Add to Wishlist
    Download
    AI Customize
    Semi circular meter template with green, lime, yellow, and red sections, each displaying thumbs up icons, and text.
    Free
    Add to Wishlist
    Download
    AI Customize
    Effective Speedometer PowerPoint Template Presentation