Professional Dashboard Slide Template for Business Analysis

Dashboard slide showcasing three purple speedometer style gauges with captions on a black background.
P.ID : 17080
    239 views
    3 Downloads
    Get Custom Slides by Experts
    Instantly Access Templates in PowerPoint

    Dashboard PowerPoint Template and Google Slides Themes


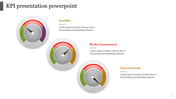
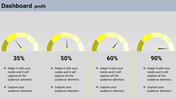
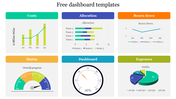
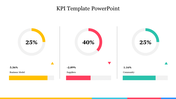
    Dive into the fast lane of presentation excellence with our Dashboard Template – where speed and clarity converge to drive your message forward! Featuring three striking speedometers in a vibrant pink hue against a clean dark background, this template sets the stage for dynamic data visualization. Below each speedometer lies expansive space for detailed text, allowing you to delve deep into metrics, insights, and analysis. 

    Whether you're monitoring project progress, tracking performance metrics, or presenting key KPIs, Velocity Vision empowers you to convey information with precision and impact. Compatible with both PowerPoint and Google Slides, this template ensures seamless adaptability across platforms. Accelerate your presentations to new heights and steer towards success with the dynamic energy of Velocity Vision!

    Features of the template


    • 100% customizable slides and easy to download.
    • Slides are available in different nodes & colors.
    • The slide contains 16:9 and 4:3 formats.
    • It is easy to change the colors of the slide quickly. 
    • Well-crafted template with an instant download facility.
    Advertisement

    You May Also Like These PowerPoint Templates

    Free
    Add to Wishlist
    Download
    AI Customize
    Free Dashboard Templates For PowerPoint & Google Slides
    Add to Wishlist
    Download
    AI Customize
    Brand perception map illustrating consumer views on six brand tastes and natural qualities, with color coded labels.
    Add to Wishlist
    Download
    AI Customize
    A color-coded pie chart illustrating four data segments with values 15%, 20%, 30%, and 35%, paired with text captions.
    Add to Wishlist
    Download
    AI Customize
    Dashboard slide displaying data through colorful bar charts, a pie chart, and a project timeline with phase completions.
    Free
    Add to Wishlist
    Download
    AI Customize
    Semi circular speedometer graphic with red to yellow gradient, and three placeholder text below.
    Add to Wishlist
    Download
    AI Customize
    RAG status slide with a task table featuring colored status indicators and four charts, including pie and line graphs.
    Add to Wishlist
    Download
    AI Customize
    Comparison chart slide with two bar graphs comparing four categories with values ranging from 20 to 80 with percentages.
    Add to Wishlist
    Download
    AI Customize
    KPI dashboard slide showing multiple charts, including bar, line, pie, and gauge charts with tracking business data.
    Free
    Add to Wishlist
    Download
    AI Customize
    KPI Template PPT Presentation Slide With Bar Chart
    Free
    Add to Wishlist
    Download
    AI Customize
     Sales Dashboard PPT Template & Google Slide Themes
    Add to Wishlist
    Download
    AI Customize
    Three speedometer charts slide with captions indicating different data points, highlighted in green, yellow, and orange.
    Free
    Add to Wishlist
    Download
    AI Customize
    Free Dashboard PowerPoint Template Design template
    Add to Wishlist
    Download
    AI Customize
    Four semi circular charts showing shipment percentages by country, with icons below for delivery status and order rates.
    Add to Wishlist
    Download
    AI Customize
    KPI report slide displaying software sales, downloads, and attendance metrics with speedometer gauges and growth indicators.
    Add to Wishlist
    Download
    AI Customize
    Logistics KPI PowerPoint Template and Google Slides
    Add to Wishlist
    Download
    AI Customize
    Two circular charts show metrics in red and green, representing key performance indicators for warehouse operations.
    Add to Wishlist
    Download
    AI Customize
    KPI slide highlighting essential business metrics alongside color coded sections for quick reference and analysis.
    Add to Wishlist
    Download
    AI Customize
    Four colored semicircles for country data with percentages, and bottom section with three colorful circles for metrics.
    Add to Wishlist
    Download
    AI Customize
    KPI slide table with yearly financial data from FY16 to FY19 from operations to cash equivalents with placeholder text.