The Best PowerPoint Speedometer Template Presentation

Orange speedometer graphics showing performance levels at 70 and 55 in a PowerPoint presentation slide.
P.ID : 16992
    133 views
    4 Downloads
    Get Custom Slides by Experts
    Instantly Access Templates in PowerPoint

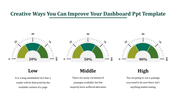
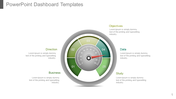
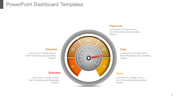
    Release Your Presentations with the Speedometer PowerPoint 


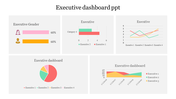
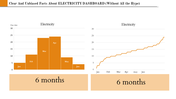
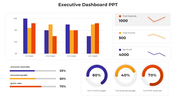
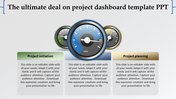
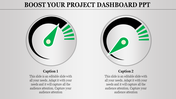
    Buckle up your presentations with the dynamic "Speedometer" feature, a standout among our template's highlights. With two nodes, each boasting a caption, title holder, and text area, your content gains velocity and clarity simultaneously. Targeting professionals in sales, analytics, and project management, this template turbocharges your data presentations, driving engagement and comprehension.

    Our unique slide design harnesses the power of visualization to convey complex metrics effortlessly. Seamlessly integrate your data into the Speedometer slide, guiding your audience through performance indicators with precision and impact. Elevate your presentations beyond the ordinary, empowering your message with the Speedometer PowerPoint Template and Google Slides Themes.

    Experience the difference. Try it now and accelerate your success story!

    Features of the Template


    • 100 % customizable slides.
    • The slide show is in 4:3, 16:9, zip format.
    • There is powerful connectivity with Google Slides and PowerPoint.
    • It is simple and quick to alter the slide's color.
    • An efficient template that can be easily accessed immediately.
    • Well-crafted template with an instant download facility.
    Advertisement

    You May Also Like These PowerPoint Templates

    Add to Wishlist
    Download
    AI Customize
    KPI template showing a bar chart with four cases, and two circular progress indicators in blue and orange showing percentage.
    Add to Wishlist
    Download
    AI Customize
    A slide displaying dashboard elements like bar graphs, a world map with data points, and progress bars, with captions.
    Add to Wishlist
    Download
    AI Customize
    Marketing KPI dashboard comparing Google, Facebook, and Bing ads, featuring clicks, cost, line charts, and campaign analysis.
    Add to Wishlist
    Download
    AI Customize
    Slide with multiple charts including bar, line, and pie charts illustrating data for hires, turnover, and training.
    Add to Wishlist
    Download
    AI Customize
    Orange speedometer slide with a gauge showing 70% progress and space for caption text below.
    Free
    Add to Wishlist
    Download
    AI Customize
    Visual of project phases and value generation over time, with milestones labeled as planning, detailing, and implementation.
    Free
    Add to Wishlist
    Download
    AI Customize
    Tachometer PowerPoint slide featuring a colorful gauge with segments labeled with space for captions on a white backdrop.
    Add to Wishlist
    Download
    AI Customize
    Business slide with four sections representing different concepts Equality, Human Rights, Independent, and Multi Party.
    Add to Wishlist
    Download
    AI Customize
    Executive dashboard with a pie chart, vertical and horizontal bar graph, and a waterfall chart, displaying various data.
    Add to Wishlist
    Download
    AI Customize
    Dashboard slide with metrics for social media, including followers, engagement, impressions, and reviews in charts.
    Add to Wishlist
    Download
    AI Customize
    Executive dashboard slide displaying colorful charts for executing dashboard to quality.
    Add to Wishlist
    Download
    AI Customize
    Business dashboard featuring a profile card, three financial metrics, a 67% circular chart, and a dual-colored area graph.
    Add to Wishlist
    Download
    AI Customize
    KPI PPT slide featuring circular progress indicators and a table of data values with captions on a white backdrop.
    Add to Wishlist
    Download
    AI Customize
    Dashboard summary featuring progress visualizations, names, task status updates, and rewards marked with gold stars.
    Add to Wishlist
    Download
    AI Customize
    Sales KPI PPT slide featuring charts for Revenue, Revenue Comparison, New Customers, and Customer Acquisition Cost CAS.
    Add to Wishlist
    Download
    AI Customize
    A colorful dashboard PowerPoint slide featuring graphs, stats, and a pie chart for a data driven presentation with captions.
    Add to Wishlist
    Download
    AI Customize
    Dashboard PowerPoint slide featuring three speedometer style gauges displaying percentages with a dartboard graphic.