MILESTONE 🌟 5 Million+ creative minds trust SlideEgg! Grab 80% OFF

Impressive PowerPoint Chart Template And Google Slides

Chart template with a split layout, featuring a stacked bar chart on the right and a dark overlay with text and a button.
P.ID : 35210
    157 views
    10 Downloads
    Get Custom Slides by Experts
    Instantly Access Templates in PowerPoint

    Dynamic PowerPoint Chart Template Presentation


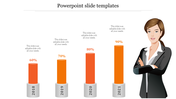
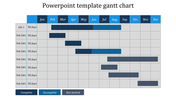
    You're presenting, but yawns erupt from the audience. Their eyes glaze over at the same old charts. Break the cycle with this dynamic PowerPoint chart template!

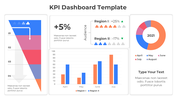
    Three color-coded sections make your data sing. Imagine using one color for growth, another for challenges, and a third for key takeaways. It's storytelling with a bar chart! Plus, add background images to truly set the scene.

    This isn't just for fancy business meetings. Educators, you can liven up lectures! Students, make project presentations pop! This template is your secret weapon for clear, memorable presentations.

    Stop wasting time formatting. This template is ready to go. Simply plug in your data, tweak the colors, and you're ready to shine. No design skills are needed. So leave the dull charts and grab attention with this color-coded beauty!

    Features of the template


    • 100% customizable slides and easy to download.
    • The slides contain 16:9 and 4:3 formats.
    • Easy to change the colors quickly.
    • It is a well-crafted template with an instant download facility.
    • It is a 100% pre-designed slide.
    • The slide holds vibrant colors.
    Advertisement

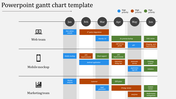
    You May Also Like These PowerPoint Templates

    Add to Wishlist
    Download
    AI Customize
    Dashboard showing expense meters, global percentages on a map, and a bar chart visualizing data distribution.
    Add to Wishlist
    Download
    AI Customize
    Slide deck with KPI charts and graphs for business analysis, including financials, HR performance, and customer service.
    Add to Wishlist
    Download
    AI Customize
    KPI dashboard template with a line chart, progress indicators, and bar graphs showing different performance metrics.
    Free
    Add to Wishlist
    Download
    AI Customize
    Project dashboard slide for electricity data with bar graphs showing units and amounts for different categories and months.
    Add to Wishlist
    Download
    AI Customize
    Horizontal layout featuring five purple icons connected by a bar, with detailed text columns below each step.
    Add to Wishlist
    Download
    AI Customize
    KPI dashboard template with progress bars, pie chart, bar graphs, and workload metrics in a clean blue theme.
    Add to Wishlist
    Download
    AI Customize
    Dashboard slide showing business performance, including technology, accessibility, and security scores with activity graphs.
    Free
    Add to Wishlist
    Download
    AI Customize
    A professional comparison slide featuring horizontal bar graphs displaying various percentages alongside captions with icons.
    Free
    Add to Wishlist
    Download
    AI Customize
    Dashboard with four sections showing charts, icons, and metrics in purple, red, green, and teal.
    Free
    Add to Wishlist
    Download
    AI Customize
    KPI dashboard with percentage stats, bar charts, and flow diagrams in red, blue, and orange representing data trends.
    Add to Wishlist
    Download
    AI Customize
    KPI dashboard slide displaying supplier metrics with colorful pie charts, bar graphs, and a process flow with percentages.
    Add to Wishlist
    Download
    AI Customize
    Company Annual Report slide featuring sections for overview, financial review, team management, and service offerings.
    Free
    Add to Wishlist
    Download
    AI Customize
    Project plan Gantt chart template with timeline, color coded tasks descriptions, and milestones spanning from 2017 to 2019.
    Free
    Add to Wishlist
    Download
    AI Customize
     KPI dashboard featuring colorful graphs, sales metrics, real estate charts, and visitor statistics, in a grid layout.
    Free
    Add to Wishlist
    Download
    AI Customize
    A detailed Gantt chart slide illustrating project timelines with tasks spanning different durations for 2021 and 2022.