Organizational Chart PowerPoint Template and Google Slides

Slide showing a chart with a central blue node leading to multiple yellow, green, and red hierarchical boxes.
P.ID : 33361
    581 views
    66 Downloads
    Get Custom Slides by Experts
    Instantly Access Templates in PowerPoint

    Organizational Chart PowerPoint Template and Google Slides


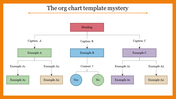
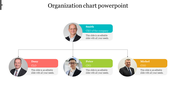
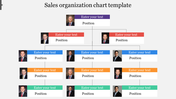
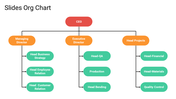
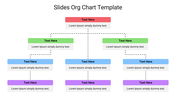
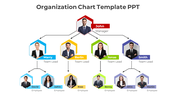
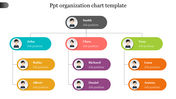
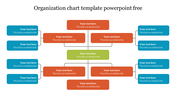
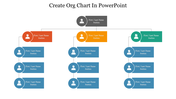
    Our Organization Chart PowerPoint Template and Google Slides offer a clear and structured layout for presenting organizational hierarchies and structures to your audience. With a single title box at the top, followed by three main divisions, and further split into two sections each, finally branching into three parts, this template provides a comprehensive overview of your organization's structure.

    This template is particularly useful for illustrating reporting relationships, departmental divisions, and team structures within your organization. You can enhance understanding and transparency among stakeholders, employees, and team members. Whether you're delivering a presentation on organizational changes, team restructuring, or departmental roles and responsibilities.

    Our Organization Chart template offers a professional and visually appealing way to convey complex information effectively. Download our Organization Chart PowerPoint Template and Google Slides to streamline your presentations and provide clarity on your organization's structure and hierarchy.

    Features of the template

    • 100% customizable slides and easy to download.
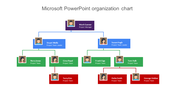
    • Slides are available in different nodes & colors.
    • The slide contains 16:9 and 4:3 formats.
    • It is easy to change the colors of the slide quickly. 
    • Well-crafted template with an instant download facility.
    Advertisement

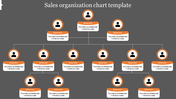
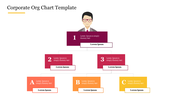
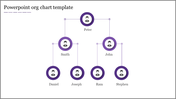
    You May Also Like These PowerPoint Templates

    Add to Wishlist
    Download
    AI Customize
    Organization chart with blue, purple, and green rectangular boxes with circular icons, displaying team hierarchy.
    Add to Wishlist
    Download
    AI Customize
    Organizational chart with three tiers of hexagonal icons in blue, orange, and purple representing various positions.
    Add to Wishlist
    Download
    AI Customize
    Hierarchical chart with hexagonal icons, showing three levels of job roles in red, blue, green, and orange boxes.
    Add to Wishlist
    Download
    AI Customize
    Colorful circular organizational chart slide showing a central hub connected to eight divisions with captions.
    Free
    Add to Wishlist
    Download
    AI Customize
    Organization chart template featuring a hierarchical structure with orange, green, and red boxes connected by lines.
    Add to Wishlist
    Download
    AI Customize
    Organizational framework diagram featuring a leader, linked to five circles in different colors representing various roles.
    Add to Wishlist
    Download
    AI Customize
    Circular organizational chart showing one main leader at the top with five connected subordinates, each in a colored circle.
    Add to Wishlist
    Download
    AI Customize
    Organization chart template featuring a hierarchical structure with the CEO at the top, followed by team members below.
    Add to Wishlist
    Download
    AI Customize
    Multicolor flowchart showing CEO at the top and team members below in rounded boxes with dotted connections.
    Add to Wishlist
    Download
    AI Customize
    An organizational structure chart with color-coded team members connected by lines, highlighting different levels.
    Add to Wishlist
    Download
    AI Customize
    Hierarchy chart slide representing company structure, with CEO leading three departments headed by CLO, CFO, and COO.
    Add to Wishlist
    Download
    AI Customize
    Green flowchart layout with rounded diamond shapes showing a company hierarchy, featuring photos and titles in each box.
    Free
    Add to Wishlist
    Download
    AI Customize
    BCG matrix template with red quadrants arranged by market share and growth, including labeled icons.
    Add to Wishlist
    Download
    AI Customize
    Organizational chart with cylindrical bar representations in red, black, and green, showing percentage values.