Data Analytics PowerPoint Template and Google Slides themes

An informative slide design showcasing two data analytics segments, each represented with icons and descriptive text.
P.ID : 25784
    252 views
    3 Downloads
    Get Custom Slides by Experts
    Instantly Access Templates in PowerPoint

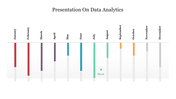
    Data Analytics Presentation Template


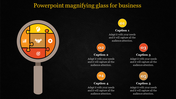
    Our data analysis presentation template and Google Slides makes it easy to share your findings in meetings, presentations, or reports. It's designed to help everyone understand even complex information.


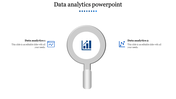
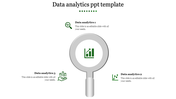
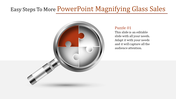
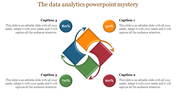
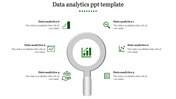
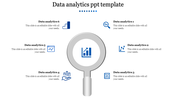
    User-friendly Design: The template looks clean and simple, with a grey magnifying glass icon showing we're looking at data. There are two parts you can change to talk about your important points or what you've found in the data.

    Customize to Your Style: You can change the colors and design to match your company or personal style. This means your presentation will always look like it belongs to you.

    Who Can Use It: Anyone who works with data, like business people or students, can use this template. It's made for everyone to understand and use easily.

    Incorporating logos, colors, and fonts consistent with the presenter's brand. Download our data presentation template now and start sharing your data confidently. 

    Features of the template:


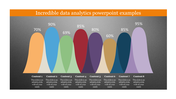
    • Slides are available in different nodes & colors.
    • Easy to change the slide colors.
    • Well-crafted template with instant download.
    Advertisement

    You May Also Like These PowerPoint Templates

    Add to Wishlist
    Download
    AI Customize
    Best Data Analysis PPT Template free Slide
    Add to Wishlist
    Download
    AI Customize
    Best Data Cleansing Infographics PPT And Google Slides
    Add to Wishlist
    Download
    AI Customize
    Easily Use Data Migration PPT And Google Slides Templates
    Add to Wishlist
    Download
    AI Customize
    Slide deck showing data valuation methods, using colorful arrows, text boxes, and icons in a clean and modern layout.
    Add to Wishlist
    Download
    AI Customize
    Data Scientist Responsibilities Google Slides Templates
    Add to Wishlist
    Download
    AI Customize
    Data classification slides illustrate a circular process with four steps with different layout designs and icons.
    Add to Wishlist
    Download
    AI Customize
    A visual diagram explaining the key responsibilities of a data scientist in color coded arrows on a white backdrop.
    Add to Wishlist
    Download
    AI Customize
    Gray background with a black magnifying glass highlighting a graph icon, paired with two captions.
    Add to Wishlist
    Download
    AI Customize
    A flowchart slides illustrating the data hygiene process with steps in different layout designs accompanied by icons.
    Add to Wishlist
    Download
    AI Customize
    Slide deck comparing the roles of data scientist and engineer, with color coded sections and clear definitions.
    Add to Wishlist
    Download
    AI Customize
    A PPT slide showing various data visualization charts and graphs for data analysis with placeholder text on a blue theme.
    Free
    Add to Wishlist
    Download
    AI Customize
    Gray themed infographic with a magnifying glass icon on the left and three numbered text sections on the right.
    Add to Wishlist
    Download
    AI Customize
    Data scrubbing process diagram PPT slides showcasing steps with different colorful layout designs and icons.
    Add to Wishlist
    Download
    AI Customize
    PowerPoint template showing a magnifying glass with puzzle pieces, demonstrating the steps to increasing sales with captions.
    Free
    Add to Wishlist
    Download
    AI Customize
    Monthly production analysis chart with three color-coded products pink, purple, and blue bars for January to July.
    Add to Wishlist
    Download
    AI Customize
    Hand holding a magnifying glass in the center, surrounded by four colorful icons with captions in an arc layout.
    Add to Wishlist
    Download
    AI Customize
    Slide with a green magnifying glass illustration highlighting three numbered points with circular markers on the right.
    Add to Wishlist
    Download
    AI Customize
    A collection of business data analysis PPT slides with colorful charts and infographics with icons on a white backdrop.