Best Dashboard PPT template and Google Slides Design

Clock themed Dashboard PowerPoint slide with captions for each section.
P.ID : 18103
    243 views
    4 Downloads
    Get Custom Slides by Experts
    Instantly Access Templates in PowerPoint

    Simple Dashboard PPT template presentation


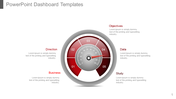
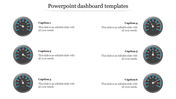
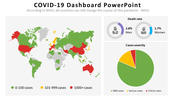
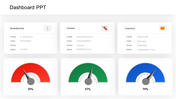
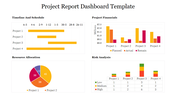
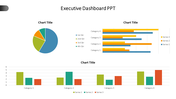
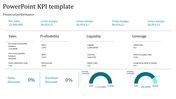
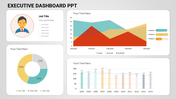
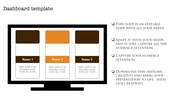
    Struggling to turn your data into presentations that people won't snooze through? Dashboard PowerPoint Templates are your secret weapon! These templates take confusing spreadsheets and transform them into clear and colorful "dashboards" that showcase your key points. Imagine a slide with three dashboard images, like mini control centers for your information. This template is perfect for anyone who wants to show data in a way that's easy to understand, from teachers explaining student progress to business people tracking sales figures. Each dashboard has space for captions, titles, and details to explain what the data means.
    Plus, the visual format makes it easy for your audience to see what's important. No more overwhelming your audience with numbers! This template is a time-saver too. Swap out the placeholder text with your information and customize the colors to match your style. Dashboard PowerPoint Templates: They'll transform your presentations from data graveyards to clear and engaging roadmaps to success. Download yours today and watch your audience go from confused to "Aha!"

    Features of the template


    • 100% customizable slides and easy to download.
    • The slides contain 16:9 and 4:3 formats.
    • Easy to change the colors quickly.
    • It is a well-crafted template with an instant download facility.
    • It is a 100% pre-designed slide.
    • The slide holds vibrant colors.
    Advertisement

    You May Also Like These PowerPoint Templates

    Add to Wishlist
    Download
    AI Customize
    Dashboard layout including a bar chart of company data, a pie chart for quarterly sales distribution.
    Add to Wishlist
    Download
    AI Customize
    KPI template with three gauges displaying progress levels for sales, production, and downloads.
    Free
    Add to Wishlist
    Download
    AI Customize
    Pie chart in orange, red, green, and blue sections with two text labels on either side, highlighting sales performance.
    Add to Wishlist
    Download
    AI Customize
    A dashboard PPT slide with bar charts for Zantedeschia, Celosia, and Calendula, and three colorful gauge indicators.
    Add to Wishlist
    Download
    AI Customize
    Attractive PowerPoint KPI Dashboard Presentation Template
    Add to Wishlist
    Download
    AI Customize
    Dashboard presentation slide with a line chart trend and circular charts highlighting project progress percentages.
    Add to Wishlist
    Download
    AI Customize
    Dashboard gauge chart PPT template with color coded sections for big loss, loss, break even, profit, and high profit.
    Add to Wishlist
    Download
    AI Customize
    Internet speed dashboard featuring two routers with speed performance indicators and mobile phones.
    Add to Wishlist
    Download
    AI Customize
    Infographic charts for PowerPoint slide featuring bar, pie, and map charts in different styles and colors.
    Add to Wishlist
    Download
    AI Customize
    Executive dashboard slide with gender bar chart, line graph,pie chart, and area chart for executive data analysis.
    Add to Wishlist
    Download
    AI Customize
    Electricity dashboard showing a bar chart on the left and a line chart on the right, depicting electricity data.
    Add to Wishlist
    Download
    AI Customize
    Dashboard slide with three gauges displaying percentage levels, labeled low, middle, and high with placeholder text.
    Add to Wishlist
    Download
    AI Customize
    Executive dashboard slide featuring a bar chart for weekly data, financial stats, line graphs, and three progress indicators.
    Add to Wishlist
    Download
    AI Customize
    Dashboard overview slide displaying traffic, payment, server load, expenses, and product metrics using graphs and charts.
    Free
    Add to Wishlist
    Download
    AI Customize
    Bar graph comparing financial data with blue and purple theme, with a text box explaining a high level approach.
    Free
    Add to Wishlist
    Download
    AI Customize
    Green radial gauge with a modern layout, surrounded by five labeled rectangular sections on a neutral background.
    Add to Wishlist
    Download
    AI Customize
    Colorful dashboard PPT slide with world map, pie charts, bar graphs, and metrics with placeholder text.