MILESTONE 🌟 5 Million+ creative minds trust SlideEgg! Grab 80% OFF

Dynamic Chart Presentation Template and Google Slides Themes

Chart layout with four sections featuring bar charts, pie charts, line charts, and warning icons, each with captions.
P.ID : 18842
    183 views
    2 Downloads
    Get Custom Slides by Experts
    Enhance Your Presentations with Add-ins
    Google Slides Add-in
    Access templates directly in Google Slides
    Microsoft PowerPoint Add-in
    Access templates directly in PowerPoint
    GPT Add-on
    AI-powered presentation assistance

    Dynamic Chart Presentation Template and Google Slides Themes


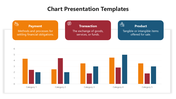
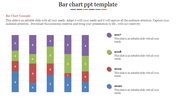
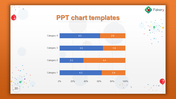
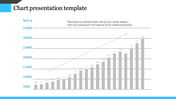
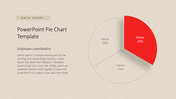
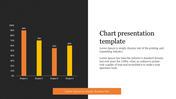
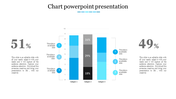
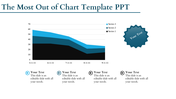
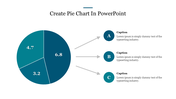
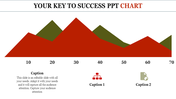
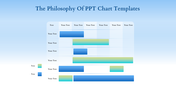
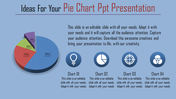
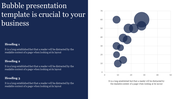
    Enhance your data-driven presentations with our versatile Chart Presentation template, compatible with both PowerPoint and Google Slides. This template features four squares, each housing a different type of chart - line chart, bar chart, pie chart, and area chart. 

    Perfect for showcasing various data sets and analysis. With dedicated space for text and values, you can provide insightful commentary and context to your charts, empowering your audience to glean valuable insights. The crisp white background ensures optimal contrast, while the blue color palette adds a touch of professionalism and visual appeal. 

    Whether you're presenting financial data, market trends, or performance metrics, our Chart Presentation template is your go-to solution. Download now and make your data presentations stand out!

    Features of the template

    • 100% customizable slides and easy to download.
    • Slides are available in different nodes & colors.
    • The slide contains 16:9 and 4:3 formats.
    • It is easy to change the colors of the slide quickly. 
    • Well-crafted template with an instant download facility.
    Advertisement

    You May Also Like These PowerPoint Templates

    Add to Wishlist
    Download
    AI Customize
    Chart presentation template displaying monthly data for Visitors, New Customers, and Leads with bar and line charts.
    Add to Wishlist
    Download
    AI Customize
    Chart presentation template showing statistics for total clients, projects, and earnings with bar graphs.
    Add to Wishlist
    Download
    AI Customize
    Gantt chart PowerPoint template displaying project tasks over a four week timeline with placeholder text.
    Add to Wishlist
    Download
    AI Customize
    Versatile PowerPoint Chart Templates for Data Insights
    Add to Wishlist
    Download
    AI Customize
    Horizontal bar chart with three color-coded series, labeled values, and a left side legend with numbered captions.
    Add to Wishlist
    Download
    AI Customize
    Slide deck with multiple circular progress bars in various colors, showing percentages and captions below.
    Add to Wishlist
    Download
    AI Customize
    Slide with a horizontal bar chart on the left and 3D cylindrical percentage charts in blue, green, and teal, on the right.
    Add to Wishlist
    Download
    AI Customize
    Horizontal bar chart with four labeld sections A to D, in purple, pink, teal, and blue, and captions below.
    Add to Wishlist
    Download
    AI Customize
    Business chart slide with a red and black line graph on the left, a red bar chart on the right, and two description sections.
    Add to Wishlist
    Download
    AI Customize
    Best Waterfall In PowerPoint Presentation Slide Designs
    Free
    Add to Wishlist
    Download
    AI Customize
    Layered area chart with Series 1 in yellow, Series 2 in orange, and Series 3 in black, showing data trends over time.
    Add to Wishlist
    Download
    AI Customize
    Clustered bar chart comparing data across quarters with horizontal bars in various colors.
    Add to Wishlist
    Download
    AI Customize
    Slide with three vertical boxes in blue, red, and green banners, and rounded icons labeled K, W, and L for learning stages.
    Add to Wishlist
    Download
    AI Customize
    PowerPoint chart template showing stacked bar graphs with different categories and values for each year from 2016 to 2019.
    Add to Wishlist
    Download
    AI Customize
    Line graph infographic showing data from 2015 to 2020, with three colored lines in purple, yellow, and green, and text.
    Add to Wishlist
    Download
    AI Customize
    Donut chart in blue and orange displaying percentage, with matching colored caption boxes on either side.
    Add to Wishlist
    Download
    AI Customize
    Our Predesigned Chart Templates PPT Slides Designs
    Add to Wishlist
    Download
    AI Customize
    KWL chart slide with three columns in blue, red, and gold, representing learning insights.