Best Chart Presentation Template and Google Slide Themes

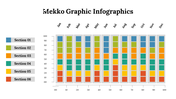
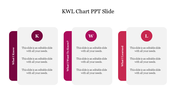
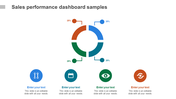
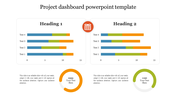
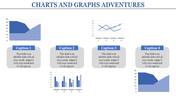
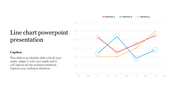
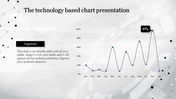

Chart Presentation Templates and Google Slides Themes
Our Chart Presentation templates are here to make your slides look amazing. Whether you're at work, school, or anywhere else, these templates help you share your data in a cool way.
What is so unique about our slide:
These templates have colorful graphs image in bold red, with space for extra info in three text boxes. They make your presentations easy to find and look really awesome.
Purpose of the Slide:
Use this slide to show off your data in a simple way. Whether it's numbers, trends, or anything else, these charts help your audience understand the info easily.
Who Can Use:
Anyone can use these templates! Whether you're giving a report, presenting a project, or having a meeting, these slides help you share your data effectively.
Get our Chart Presentation Slide now and turn your data into eye-catching visuals. Start impressing your audience today!
Features of the template
- 100% customizable slides and easy to download.
- Slides are available in different nodes & colors.
- The slide contains 16:9 and 4:3 formats.
- It is easy to change the colors of the slide quickly.
- Well-crafted template with an instant download facility.


You May Also Like These PowerPoint Templates
Add to Wishlist
Download
AI Customize

Add to Wishlist
Download
AI Customize

Add to Wishlist
Download
AI Customize

Add to Wishlist
Download
AI Customize

Add to Wishlist
Download
AI Customize

Add to Wishlist
Download
AI Customize

Add to Wishlist
Download
AI Customize

Add to Wishlist
Download
AI Customize

Add to Wishlist
Download
AI Customize

Add to Wishlist
Download
AI Customize

Add to Wishlist
Download
AI Customize

Add to Wishlist
Download
AI Customize

Add to Wishlist
Download
AI Customize

Add to Wishlist
Download
AI Customize

Free
Add to Wishlist
Download
AI Customize

Add to Wishlist
Download
AI Customize

Add to Wishlist
Download
AI Customize

Add to Wishlist
Download
AI Customize

Add to Wishlist
Download
AI Customize

Add to Wishlist
Download
AI Customize
