Chart Presentation Template for Effective Data Visualization

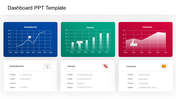
Editable Chart Presentation Template
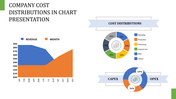
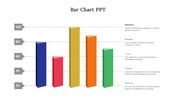
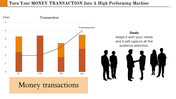
Create impactful presentations with our variety of chart templates. Turn complex data into engaging stories that resonate with your audience.
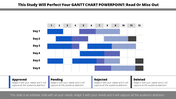
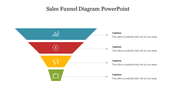
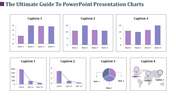
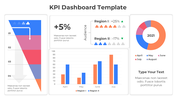
This slide showcases four distinct charts: a hierarchy, flow, network, and quadrant, all against a simple backdrop. The clean design ensures your content shines, while the charts offer clarity to your message. Impress your audience with a professional presentation that conveys your ideas effectively.
Our templates cater to professionals, students, and anyone seeking visual impact. Download our editable chart templates today and enhance your next presentation.
Features of the template:
- Easy to change the slide colors.
- 100 % customizable slides and easy to download.
- Well-crafted template with instant download.


You May Also Like These PowerPoint Templates

Add to Wishlist
Download
Edit

Add to Wishlist
Download
Edit

Add to Wishlist
Download
Edit

Add to Wishlist
Download
Edit

Add to Wishlist
Download
Edit

Add to Wishlist
Download
Edit


Add to Wishlist
Download
Edit

Add to Wishlist
Download
Edit

Add to Wishlist
Download
Edit

Add to Wishlist
Download
Edit


Add to Wishlist
Download
Edit


Add to Wishlist
Download
Edit

Add to Wishlist
Download
Edit


