Chart PowerPoint Presentation For Title Slide Template

PowerPoint slide featuring a line chart with points plotted over a blue background and a title.
P.ID : 34528
    187 views
    12 Downloads
    Get Custom Slides by Experts
    Instantly Access Templates in PowerPoint

    "Empower Your Data Storytelling with Chart PowerPoint Template"


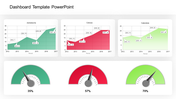
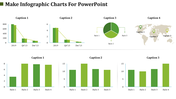
    Illuminate your presentations with the Chart PowerPoint Template and Google Slides Themes. This dynamic template boasts a sleek area graph in a captivating blue hue, accentuating your data with flair. With designated captions, a versatile title holder, and a spacious text area, crafting compelling narratives has never been easier.

    Whether you're a marketing maven analyzing trends or a business guru presenting growth projections, this template caters to all. Seamlessly designed for professionals seeking clarity and impact, it ensures your data takes center stage. Don't settle for mundane slides; captivate your audience with this template's modern aesthetics and user-friendly interface.

    Improve your next presentation and transform data into insights that resonate. Download now to enhance your storytelling prowess!

    Features of the Template

    • 100 % customizable slides.
    • The   slide show is in 4:3, 16:9, zip format.
    • There is powerful connectivity with Google Slides and PowerPoint.
    • It is simple and quick to alter the slide's color.
    • An efficient template that can be easily accessed immediately.
    • Well-crafted template with an instant download facility.
    Advertisement

    You May Also Like These PowerPoint Templates

    Free
    Add to Wishlist
    Download
    AI Customize
    Template with six green bar graphs labeled by years from 2016 to 2021, and a woman in a formal outfit.
    Free
    Add to Wishlist
    Download
    AI Customize
    Bar chart comparing business targets and profits across quarters, with orange and blue bars labeled by month.
    Free
    Add to Wishlist
    Download
    AI Customize
    PPT slide with a line chart showing monthly data and two pie charts for quarterly breakdown.
    Add to Wishlist
    Download
    AI Customize
    Electricity dashboard showing a bar chart on the left and a line chart on the right, depicting electricity data.
    Add to Wishlist
    Download
    AI Customize
    Dashboard slide with three gauges displaying percentage levels, labeled low, middle, and high with placeholder text.
    Add to Wishlist
    Download
    AI Customize
    Executive dashboard slide featuring a bar chart for weekly data, financial stats, line graphs, and three progress indicators.
    Add to Wishlist
    Download
    AI Customize
    Colorful pie chart in PowerPoint slide showing 60, 30, and 10 percent segments with text boxes on a white backdrop.
    Add to Wishlist
    Download
    AI Customize
    Dashboard overview slide displaying traffic, payment, server load, expenses, and product metrics using graphs and charts.
    Free
    Add to Wishlist
    Download
    AI Customize
    Bar graph comparing financial data with blue and purple theme, with a text box explaining a high level approach.
    Add to Wishlist
    Download
    AI Customize
    PowerPoint template showing a line graph with three products A, B, and C plotted over time from 2015 to 2019.
    Add to Wishlist
    Download
    AI Customize
    Company annual report slide featuring financial data including net income, assets, deposits, and shareholders' equity.
    Add to Wishlist
    Download
    AI Customize
    Slide with a pie chart and a numbered list of five levels, each in orange, red, blue, green, and yellow.
    Add to Wishlist
    Download
    AI Customize
    Company annual report template featuring a line chart with two data series and space for points and descriptions with text.
    Free
    Add to Wishlist
    Download
    AI Customize
    Timeline slide with horizontal bars in shades of green and blue, aligned to weekdays with placeholder text.
    Free
    Add to Wishlist
    Download
    AI Customize
    KWL chart PowerPoint template with sections for What I Know, What I Want to Know, and What I Learned with placeholder text.
    Add to Wishlist
    Download
    AI Customize
    Use Dashboard PPT Template Slide Designs
    Add to Wishlist
    Download
    AI Customize
    Slide with three donut shaped percentage charts showing 70%, 50%, and 90%, with corresponding captions beneath each.
    Add to Wishlist
    Download
    AI Customize
    Gantt chart in blue tones, showing task progress over weeks with horizontal bars and assigned team members.