MILESTONE 🌟 5 Million+ creative minds trust SlideEgg! Grab 80% OFF

Buy Highest Quality Predesigned Chart PPT Template

Chart PPT template showing monthly revenue trends with captions highlighting key information and the year 2019.
P.ID : 17834
    172 views
    3 Downloads
    Get Custom Slides by Experts
    Enhance Your Presentations with Add-ins
    Google Slides Add-in
    Access templates directly in Google Slides
    Microsoft PowerPoint Add-in
    Access templates directly in PowerPoint
    GPT Add-on
    AI-powered presentation assistance

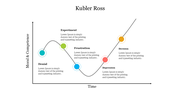
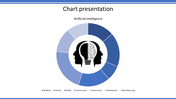
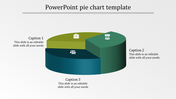
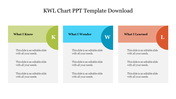
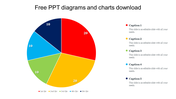
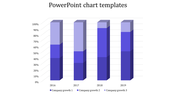
    Chart PPT  Presentation Template


    Get ready to make an Effective presentation with our Chart PowerPoint template.

    Slide Description:

    Our sleek and modern design meets functionality head-on. The centerpiece? An area chart that tells the story of revenue trends over months. It’s not just data; it’s artistry. Two caption boxes flank the chart, providing space for context, insights, or key takeaways. And yes, every element is customizable to fit your unique needs.

    Who Can Benefit?

    Professionals: Nail that business pitch, impress clients, and drive results.
    Students: Ace your presentations, stand out in class, and make your ideas shine.
    Anyone: Whether it’s a conference, workshop, or personal project, our templates simplify the complex.

    Why Choose Our Templates?

    Clarity: Visualize complex information effortlessly.
    Engagement: Keep your audience hooked from slide one.

    Click below to explore our range of chart PPT templates. Quality meets simplicity, innovation meets design, and ideas find their fullest expression.

    Features of the template:

    •  Slides are available in 4:3 & 16:9
    • Get slides that are 100% customizable and easy to download
    • Highly compatible with PowerPoint and Google Slides.
    Advertisement

    You May Also Like These PowerPoint Templates

    Free
    Add to Wishlist
    Download
    AI Customize
    Pie chart slide with a blue and dark blue donut chart showing 75% sales, two numbered text boxes on the right.
    Free
    Add to Wishlist
    Download
    AI Customize
    Green and black area chart with a star shaped yellow badge and four circular icons with text below.
    Add to Wishlist
    Download
    AI Customize
    Bar chart with green hues, showing data for six categories, with side status boxes and light text.
    Free
    Add to Wishlist
    Download
    AI Customize
    Three column layout with blue megaphone, orange lightbulb, and red envelope icons on a beige background.
    Add to Wishlist
    Download
    AI Customize
    3D triangular bar chart in yellow, orange, and blue shades showing monthly data for four categories, on a dark background.
    Free
    Add to Wishlist
    Download
    AI Customize
    A simple chart slide with overlaid blue, green, orange, and yellow circles of varying sizes with a graph and captions.
    Add to Wishlist
    Download
    AI Customize
    Gantt chart PowerPoint template showing a timeline for multiple targets across January, February, and March, with milestones.
    Add to Wishlist
    Download
    AI Customize
    Bar chart slide showcasing yearly data from 2016 to 2021, with three distinct bar categories and values in shades of purple.
    Add to Wishlist
    Download
    AI Customize
    3D cone chart with orange, pink, and blue segments, placed on a gray platform with a white background.
    Add to Wishlist
    Download
    AI Customize
    Bar chart slide showing the performance of four products with categories like sales growth, market share, and profit margin.
    Add to Wishlist
    Download
    AI Customize
    Slide displaying two pie charts with quarter wise performance data, along with performance percentages at the bottom.
    Add to Wishlist
    Download
    AI Customize
    PowerPoint slide showcasing a chart with project status trends and a progress bar for each year.
    Add to Wishlist
    Download
    AI Customize
    Slide featuring three green pie charts and a line graph below, illustrating data trends for different categories.
    Add to Wishlist
    Download
    AI Customize
    Four panel chart slide featuring a line, bar, and pie chart, each displaying data trends and comparisons.
    Free
    Add to Wishlist
    Download
    AI Customize
    Green bar graph depicting growth over six months, with two gear icons and captions on the left.
    Add to Wishlist
    Download
    AI Customize
    Slide featuring a 3D bar graph with three series on dark backdrop, a green star shaped badge, and text boxes below.
    Add to Wishlist
    Download
    AI Customize
    Donut chart showing sales distribution across four quarters with blue, orange, gray, and yellow segments.
    Free
    Add to Wishlist
    Download
    AI Customize
    Chart slide with four interlinked circular diagrams, and two radar charts in blue and green at the bottom.
    Free
    Add to Wishlist
    Download
    AI Customize
    Pie chart with four segments in white and green on a dark patterned background, alongside a text box for description.
    Free
    Add to Wishlist
    Download
    AI Customize
    World map infographic surrounded by six segments with icons for business-related captions and caption areas.